|
To view this email as a web page, click here. |
 |
|
Welcome
When you look at the labelled spectrum for a matched peptide in a Mascot Peptide View report, you may wonder why some of the peaks are not labelled, even though they could be assigned to sequence ions. All is revealed, below.
This month's highlighted publication shows how more stringent approaches to protein interaction mapping yields more confident interactomes.
If you have a recent publication that you would like us to consider for an upcoming Newsletter, please
send us a PDF or a URL.
Mascot tip of the month explains why the charge setting in the Mascot search form usually has no effect on the search.
Please have a read and feel free to contact us if you have any comments or questions. |
|
|
|
|
|
 |
|
|
|
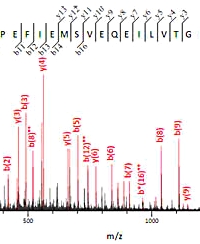
Why is that peak not labelled?
When looking at the details of a match in the Mascot Peptide View report, you may have noticed that some of the peaks that could be assigned to sequence ions go unlabelled in the spectrum graphic and are not highlighted in the table of fragment masses.
This isn't a bug. Many types of instrument can give spectra with 'peak at every mass' chemical noise. If a search engine simply counted fragment matches, these spectra would give high scores for almost any sequence. There has to be some attempt to discriminate between signal and noise, and the approach taken in Mascot is to divide the spectrum into 110 Da wide segments and take the most intense peak in each segment. The score for this set of peaks is determined, then the next most intense peak in each segment is added to the set and the score re-determined. It continues to iterate, taking additional peaks from each segment, until it is clear that the score can only get worse. The best score found is reported, which hopefully corresponds to an optimum selection, taking mostly real peaks and leaving behind mostly noise.
By default, the labels and table show the set of peaks that gave the highest score - the score being reported. In Mascot 2.3 and later, radio buttons under the spectrum can be used to switch between this mode and labelling all possible sequence ion matches.
Additional details can be found here. |
 |
|
|
|
|
|
|
|
Featured publication using Mascot
Here we highlight a recent interesting and important publication that employs Mascot for protein identification, quantitation, or characterization. If you would like one of your papers highlighted here please send us a PDF or a URL.
|
|
|
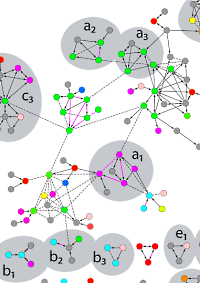
Bacterial Interactomes: Interacting Protein Partners Share Similar Function and Are Validated in Independent Assays More Frequently Than Previously Reported
Maxim Shatsky, Simon Allen, Barbara L. Gold, Nancy L. Liu, Thomas R. Juba, Sonia A. Reveco, Dwayne A. Elias, Ramadevi Prathapam, Jennifer He, Wenhong Yang, Evelin D. Szakal, Haichuan Liu, Mary E. Singer, Jil T. Geller, Bonita R. Lam, Avneesh Saini, Valentine V. Trotter, Steven C. Hall, Susan J. Fisher, Steven E. Brenner, Swapnil R. Chhabra, Terry C. Hazen, Judy D. Wall, H. Ewa Witkowska, Mark D. Biggin, John-Marc Chandonia, and Gareth Butland
Molecular & Cellular Proteomics (2016)15:1539-1555
The authors conducted an affinity purification-MS survey of the sulfate-reducing bacterium D. vulgaris and also reanalyzed nine yeast-2-hybrid and AP-MS screens for other bacteria. By using more stringent criteria for assessing the quality of protein interactomes, they concluded that the number of bona fide interactions from the earlier screens is limited to hundreds and not the thousands claimed.
The majority of AP samples were analyzed by parallel gelfree and gel-based workflows. In the gel-free approach, AP isolated proteins were digested with trypsin utilizing a 96-well PVDF membrane-based protocol and analyzed by LC MS/MS. Combined with their data analysis strategy they identified 459 high confidence protein-protein interactions for D. vulgaris and 391 from an existing AP-MS dataset for E. coli, many of which are supported by low throughput data from the literature. |
 |
|
|
|
|
|
|
|
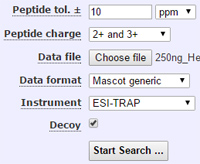
Mascot tip of the month
The peptide charge state setting in the Mascot search form is a default, which is only used when no charge state is specified in the peak list. In all common MS/MS peak list formats, the data file specifies a charge for every spectrum, so this default is rarely used, if ever, and changing it makes no difference to the search results.
If the precursor charge cannot be determined, peak detection software usually outputs a set of default charge states. So, the correct defaults need to be specified in the peak detection software, not in the Mascot search form.
Some older peak picking utilities create copies of the peak list for each of the default charges. This is undesirable because each peak list appears in the report as a separate query, even though only one of them can be correct. A better approach is demonstrated by Mascot Distiller, which outputs a single peak list with a comma separated list of default charges, enabling the search engine to select the charge state that gives the strongest match.
|
 |
|
|
|
|
|
|
|
About Matrix Science
Matrix Science is a provider of bioinformatics tools to proteomics researchers and scientists, enabling the rapid, confident identification and quantitation of proteins. Mascot software products fully support data from mass spectrometry instruments made by Agilent, Bruker, Sciex, Shimadzu, Thermo Scientific, and Waters.
Please contact us or one of our marketing partners for more information on how you can power your proteomics with Mascot.
|
 |
|
|
|
|