|
To view this email as a web page, click here. |
 |
|
Welcome
We have some background to help you understand the statistics applied to your quantitation results.
This month's highlighted publication shows a deep analysis of single amino acid variants using only a few cells.
If you have a recent publication that you would like us to consider for an upcoming Newsletter, please
send us a PDF or a URL.
Mascot tip of the month examines the pros and cons of de-charging your peak list.
Please have a read and feel free to contact us if you have any comments or questions. |
|
|
|
|
|
 |
|
|
|
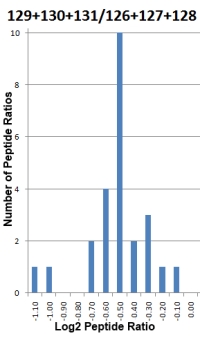
Reliable quantitation - understanding the statistics
The many quantitation methods supported by Mascot Server and Distiller are carried out at the peptide level. The peptides are then grouped into protein families, and the peptide quantitation results used to calculate protein ratio values. A number of statistical tests are utilized to give you an indication of the quality and reliability of your results.
To get the most out of your data, it is useful to understand what these tests tell you. Here is a quick summary of the tests applied.
- Significance test is used to determine if a protein ratio is significantly changed. A one sample Student's t-test is used to compare the mean of a sample population against a hypothetical value specified in a null hypothesis.
- The standard deviation of the peptide ratios determines whether the fold change in the protein ratio is significant. The higher the degree of variability, the less likely it is a significant result. The variability could be due to measurement artifacts, incorrect assignments or shared peptides from proteins that have different ratios.
- Since the Student's t-test assumes that the log values of the test population have a normal distribution, this assumption is evaluated by the Shapiro-Wilk W-test. Protein ratios that fail the test are shown in italics indicating you should assess them with greater caution.
- Several outlier removal methods are available (Dixon's, Grubbs' and Rosner's) to clean up data with unreasonable values. It is advisable to analyze the data with and without the outlier(s) and see if the conclusions are different.
- To reduce systematic error, you have the option to normalise the calculated protein ratios. This forces the mean or median ratio (depending on the selected protein ratio calculation method) for all peptides to 1.
Go here to read more about getting the most out of your quantitation results.
|
 |
|
|
|
|
|
|
|
Featured publication using Mascot
Here we highlight a recent interesting and important publication that employs Mascot for protein identification, quantitation, or characterization. If you would like one of your papers highlighted here please send us a PDF or a URL.
|
|
|
Single Amino Acid Variant Discovery in Small Numbers of Cells
Zhijing Tan, Xinpei Yi, Nicholas J. Carruthers, Paul M. Stemmer, and David M. Lubman
J. Proteome Res., Article ASAP, published online November 7, 2018
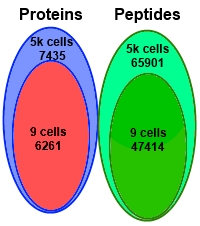
The authors performed deep proteomic profiling down to the level of nine Panc-1 cells in search of single amino acid variants (SAAV) related to cancer. They used a combination of sample fractionation, tandem mass tag labelling, a carrier/reference proteome, and analysis by LC/MS/MS.
From the 9 cells, they were able to detect 47,414 peptides and 6291 proteins, which is 84% of the number detected from 5000 cells. They attributed this coverage to three factors: use of the carrier/reference to trigger data acquisition for the selected ions, sample fractionation into 9 aliquots, and minimizing sample handling steps to reduce losses.
A critical aspect in determining the SAAVs is filtering out the many false positives. After database searching the data were investigated for variant peptide identifications based on their SAVControl software, which first filters out false peptide identifications using transfer FDR control, and then evaluates the reliability of the SAAV sites by unrestricted mass shift relocation and introduction of alternative interpretations such as modifications.
This approach found a total of 79 SAAVs from the 9-cell Panc-1 sample and 174 SAAVs from the 5000-cell Panc-1 sample. Additionally these included 8 previously reported cancer-related SAAVs derived from 8 proteins.
|
 |
|
|
|
|
|
|
|
Mascot Tip
If your raw files contain profile data and you use Mascot Distiller for peak picking, your peak list will be
de-isotoped. This happens automatically because of the way Distiller peak picking works, and it invariably improves the matching score in a database search. Whether an MS/MS peak list should also be de-charged is a user option. De-charging can be a good thing or a bad thing - it depends on the nature and quality of the raw data.
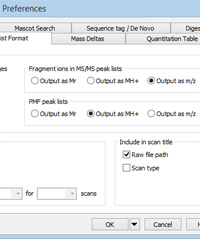
Mascot Server matches experimental MS/MS fragment masses against calculated values for singly and doubly charged ions. If significant numbers of precursors have charge states of 4+ or more, it is likely that the spectra will include fragments with charge state higher than 2+, and these will not be matched if the peak list contains m/z values. Such charge states are common with ETD ionisation and when performing top-down analysis. In such cases, to get a decent match, it becomes important to de-charge the fragments to MH+. You'll find the control on the peak list format tab of Distiller preferences, under Fragment ions in MS/MS peak lists, as shown on the right. Choose Output as MH+ to enable de-charging.
If the precursors in your data are mostly 2+ and 3+, then most fragments can be matched as m/z values and there is less benefit to de-charging. If the data are weak or noisy, and Distiller calls the charge state for an ion incorrectly, what might have matched as an m/z value no longer matches. For example, a 2+ ion where the isotope peaks are missing might be called as 1+. Or, a noise peak occurs at just the right place to make a 1+ distribution look like 2+. These things are rare in strong peaks, but become more common as the limit of detection is approached.
If you are processing data that is not ETD or top-down, so that de-charging is not a requirement, the safest way to decide whether it is a good idea is to try both, search the two peak lists, and compare sensitivity at the same FDR. Whichever gives the higher sensitivity is the better choice.
|
 |
|
|
|
|
|
|
|
About Matrix Science
Matrix Science is a provider of bioinformatics tools to proteomics researchers and scientists, enabling the rapid, confident identification and quantitation of proteins. Mascot software products fully support data from mass spectrometry instruments made by Agilent, Bruker, Sciex, Shimadzu, Thermo Scientific, and Waters.
Please contact us or one of our marketing partners for more information on how you can power your proteomics with Mascot.
|
 |
|
|
|
|