Single-cell peptide fragmentation spectra
More single-cell proteomics studies are published each year as instruments become more sensitive and sample preparation is optimised. A recent publication in the Journal of Proteome Research, Features of Peptide Fragmentation Spectra in Single-Cell Proteomics, highlights potential challenges to protein and peptide identification by database searching. Boekweg et al. computationally examined the fragmentation spectra of peptides from bulk samples, 2ng and 0.2ng aliquots, and single HeLa cells. The single cells were prepared with nanoPOTS. Key points from the article are discussed below.
Intensity compression. The authors find that “the majority of spectra from single-cell data have significant intensity compression, blurring the line between signal and noise.” Intensity compression is measured with two metrics, and the second one, T/M, is related to the signal to noise ratio. T is the mean abundance of top three annotated fragment peaks and M the median abundance of non-annotated peaks. Figure 3B in the paper plots T/M of spectra from bulk data divided by T/M from single-cell spectra. It seems the majority of single-cell spectra have lower T/M, often much lower than bulk data.
Does it affect Mascot? The software divides the observed spectrum into 100Da bins, then chooses the most intense peak in each bin. The peaks are matched to the calculated masses based only on mass delta; Mascot doesn’t try to predict fragment intensity. Next, the procedure is repeated with the top two most intense peaks in each bin up to top 10 peaks until the match score stops improving. There is a penalty term that balances the sum of matched peak intensity with the sum intensity of the selected peaks. As long as the noise is random and doesn’t completely overwhelm the fragment peaks in every bin, the algorithm is usually able to pick the signal from the noise. Adding noise tends to decrease the match score rather than prevent a match.
Number of MS/MS peaks. The second, more important finding is that single-cell spectra could have fewer y-ion peaks than bulk spectra. Boekwog et al. quantify this by counting the number of annotated y peaks from search engine output for each peptide sequence, and comparing the counts between bulk and single-cell data. Figure 2 in the paper plots the y ion gain/loss and looks a bit worrying: peptides with the most annotated y peaks in bulk data seem to lose the most annotated y peaks in single-cell data. However, it’s not clear if this is partly caused by the behaviour of the single database search engine used in the experiment. Would the plot look different with different search engines? Could it also depend on peak picking?
The authors also note that “In a typical spectrum from bulk data, the average number of peaks is 682. This number is significantly less for single-cell data: 104 peaks in 2 ng spectra, 86 in 0.2 ng spectra, and 98 in true single-cell spectra.” The comparison is a bit beside the point. A peptide of length N has N b-ions and N y-ions, so perfect fragmentation produces 2N fragment masses. There may of course be neutral losses and multiple charge states, but any additional peaks are unwanted noise for peptide identification purposes. Conversely, if the fragment peaks aren’t in the spectrum, it doesn’t matter how many other peaks are present.
More pertinent is that “although spectra from SCP are internally consistent, they are distinct from bulk proteomics spectra.” This was confirmed by comparing cosine similarity of PSMs in bulk data and single-cell PSMs. The main implication is that you should build spectral libraries specific to single-cell data, especially if the spectra are used in training machine learning tools like Prosit that predict fragmentation patterns.
Score thresholds. If signal to noise is worse and fewer fragment peaks are observed, the scores of all candidate peptides matched to the spectrum are lower, a point also made by Boekwog et al. Mascot has two score thresholds specific to each query: the identity threshold and the homology threshold. The identity threshold is derived from the count of trials (i.e., candidate peptides) and is unaffected by spectral quality. The homology threshold is an empirical measure based on the score distribution of candidate peptides. If Mascot fails to calculate the latter, it defaults to the more conservative identity threshold. One solution is to use a machine learning tool like Percolator to re-score the matches and try to improve sensitivity.
Example Mascot search. To illustrate the points, we downloaded one of the single-cell raw files from MassIVE, MSV000087524 and peak picked in Mascot Distiller. The data is from a Thermo Orbitrap and MS/MS scans are saved as centroids. The default peak picking settings are fine, although as noted in Default or prof_prof?, you can get a small improvement by using the prof_prof settings.
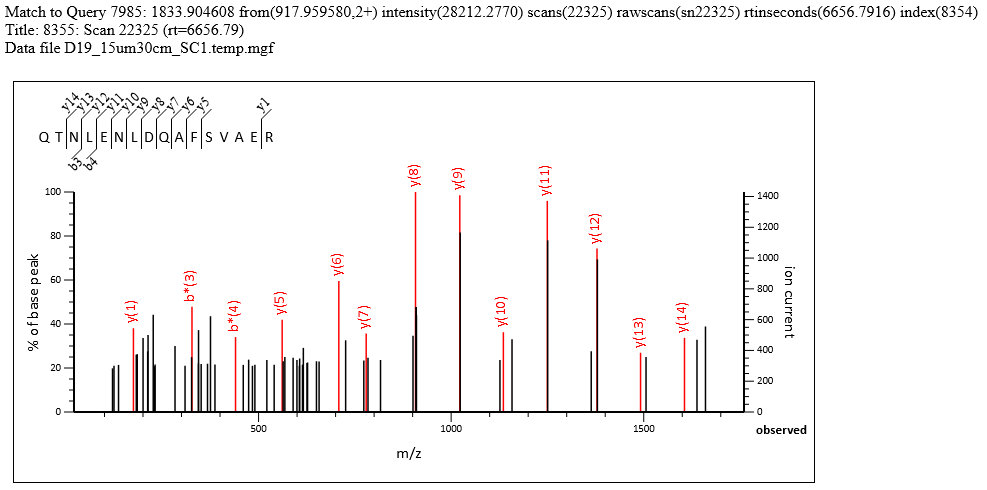
The search results have 2007 significant PSMs and 1726 significant sequences, both at 1% FDR, out of 9,902 queries. The search parameters are typical for a HeLa sample, and both precursor and fragment accuracy are within 20ppm. Many high-scoring matches are found despite tall noise peaks, such as match to QTNLENLDQAFSVAER in query 7985 shown below. The T/M metric is on either side of 3.0, with mean intensity of the top 3 y peaks around 1000-1100 and the median noise around 300-350. If you label all possible matches, most of the peaks above 30% intensity are annotated.
Another example of intensity compression is the match to AGPGTLSVTIEGPSK in query 6066. Mascot had to dig deep into each 100Da bin to find the fragment peaks, but there is a decent sequence ladder and no other candidate peptides within precursor tolerance. Most of the y ions have a +1Da peak right next to them, which are isotopic peaks and could be removed using the prof_prof peak picking options.
Enabling Percolator and using the default feature set introduced in Mascot Server 2.8 and RT enabled boosts the results to 2303 significant PSMs and 1991 significant sequences at 1% FDR, and yields 571 protein hits at 3.2% protein FDR. Pretty good for such a small number of spectra.
If the purpose of the experiment is to investigate cell heterogeneity, an interesting contraint is that you can’t have technical replicates. Each cell is measured exactly once. Probably the most impactful way to increase sensitivity and number of identified proteins is to use ion mobility separation like timsTOF or FAIMS. Ion mobility typically reduces noise and improves spectral quality, exactly the issues highlighted by Boekwog et al.
The single-cell files used in the study have fewer than 20,000 queries, so you are welcome to try searching them using our public website and dig deeper into the data. If you’d like a trial licence for Mascot Distiller, please contact us for a demo key.
Keywords: fragmentation, scoring, single-cell proteomics