Global thinking: Label Free Quantitation in Mascot Distiller 2.8
Mascot Distiller supports a wide range of precursor based quantitation methods, including two label-free methods, which we call Replicate and Average. Version 2.8 makes significant improvements to the Replicate method. This is the method for label-free quantitation based on the relative intensities of extracted ion chromatograms (XICs) for precursors in multiple data sets aligned using mass and elution time.
Replicate quantitation in Mascot 2.7 and earlier
Prior to Mascot Distiller 2.8, processing a ‘Replicate’ quantitation dataset had to be processed as a single project with the ‘memory efficient’ checkbox unchecked. Doing this means that all the raw data are loaded and processed together in Mascot Distiller, resulting in a single merged collection of peaklists from all the raw sample files in the project. These peaklists are then searched on Mascot to produce a single result file. XIC detection for the identified peptides is then carried out across all raw files. Where a peptide is not identified in a sample file, Distiller will look for its XIC peak up to a user definable retention time shift from an identified XIC peak in another file (default 500 seconds). The most intense feature identified will then be aligned to the XIC from the known values to generate peptide ratios.
Replicate quantitation in Mascot Distiller 2.8
In Mascot Distiller 2.8 global time alignment is calculated prior to XIC detection. These calculated time alignments are then used as the starting point for XIC detection in unmatched samples, allowing the raw sample files to be processed individually.
To find the time alignment shift between multiple projects, a consensus dataset is created by roughly aligning then combining all separate datasets together using the Total Ion Chromatogram (TIC) of each raw file. Rough alignment at this stage is achieved using a recursive cross correlation method adapted from signal processing. By doing this, the consensus dataset becomes an estimation of features that all projects have in common and each dataset should align to the consensus. Once the consensus has been created a more accurate alignment between each individual raw sample file and the consensus is found. This is accomplished by using a combination of the recursive cross correlation method and a least squares optimisation algorithm to fine tune the time shift over sub-setted m/z ranges. Once a time shift across all retention times and m/z values has been found, the time shift between a pair of projects can be calculated via the consensus dataset.
Some advantages of this approach are:
- Individual sample files are processed and searched individually, reducing the memory footprint. XIC detection is also carried out separately, which allows for more efficient parallelisation
- You no longer need to enter a time shift limit for the dataset as the calculated time alignment shifts are used instead
In our tests, processing the same samples on equivalent hardware, Distiller 2.8 is 2-3 times faster than Distiller 2.7.1, due mainly to the improved parallelisation of XIC detection, and uses approximately 1/3rd less memory at peak usage.
Example dataset
To test Replicate quantitation in Distiller 2.8, a set of 12 raw files was downloaded from PRIDE project PXD001385. Shalit et al.1 used the dataset to compare calculated ratios and intensities between two LFQ packages, Expressionist and MaxQuant. According to the project description: “Four groups of samples, called 3, 7.5, 10 and 15 were prepared in three replicates. The numbers indicate the amount of E. Coli (in nanograms) spike[d] into 200ng HeLa digestion, which was loaded onto the LC column for each sample. This simulated 5, 2 and 1.5 fold changes relative to the 15ng sample.”
The files were processed in Mascot Distiller 2.8 and searched using Mascot Server 2.7 against the human and E.coli proteomes plus a contaminants database using typical search settings for Thermo Q Exactive data. A total of 2072 human and 317 E.coli proteins were identified at a 1% PSM FDR. Quantitation was then carried out using ratios with expected values of 5:1, 2:1, and 1.5:1 from the E.coli proteins, and 1:1 for all human proteins across the replicates. As per the original paper, peptide ratios were normalised using the matches from 20 human proteins at the mid-intensity range, using the option to normalise to specified protein accessions in Mascot Distiller. In the original paper, protein ratios are calculated in various ways using the protein intensity values. Protein ratio calculation for Replicate quantitation in Mascot Distiller uses the mean or median of the assigned peptide ratios. We used the ‘Weighted’ protein ratio option which calculates the intensity weighted mean value, allowing for a clearer comparison between the results from Mascot Distiller and those presented in the paper. Results using median ratios are, however, very similar.
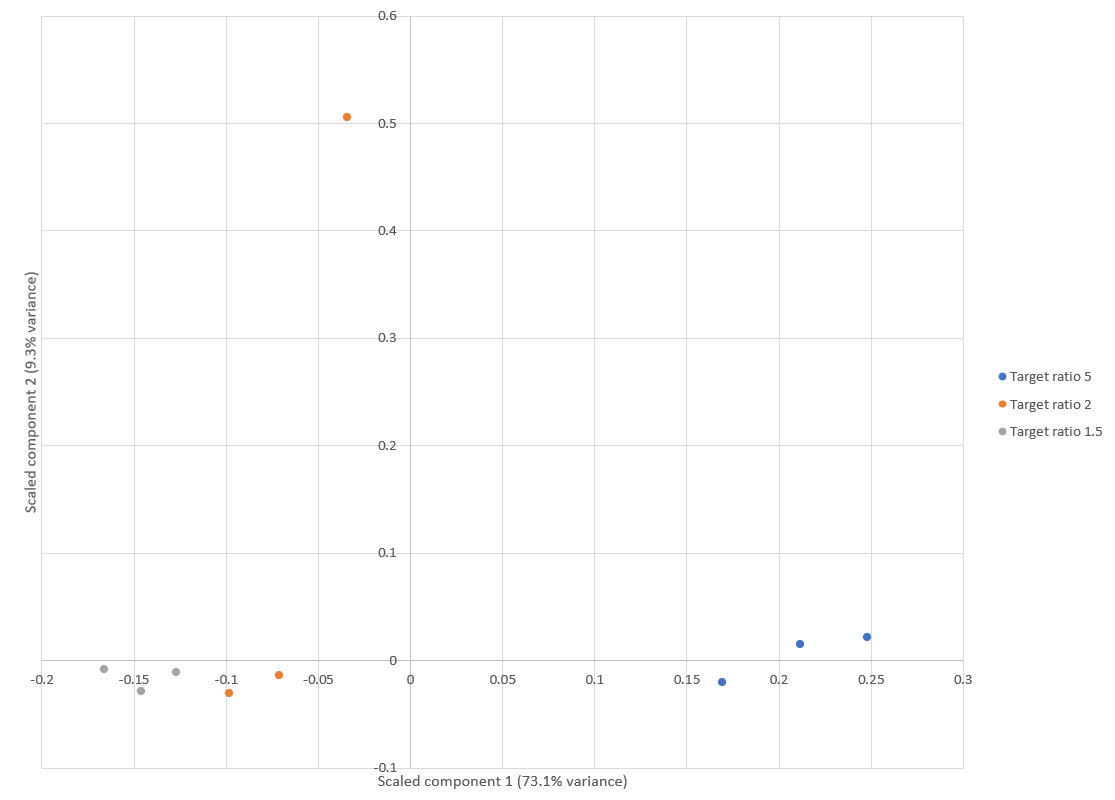
Principal component analysis (PCA) of E.coli protein ratios was used to visualise the reproducibility of quantitation across the replicates, generated using a new report added to Mascot Distiller 2.8. Results are shown in Figure 1 below. Apart from an outlier in one of the replicates of the “Target ratio 2” group (15:7.5), the replicates are clustered together within each group, demonstrating a high degree of reproducibility. This is in line with similar PCA analysis carried out by Shalit et al.1, which also identified one of the 7.5ng samples as an outlier.
Click to view full size image
Figure 1: Score plot from the PCA using E.coli protein ratios. Apart from one replicate of the “Target ratio 2” group, all the replicates cluster together and away from the other groups. This is equivalent to figure 3 in Shalit et al.1
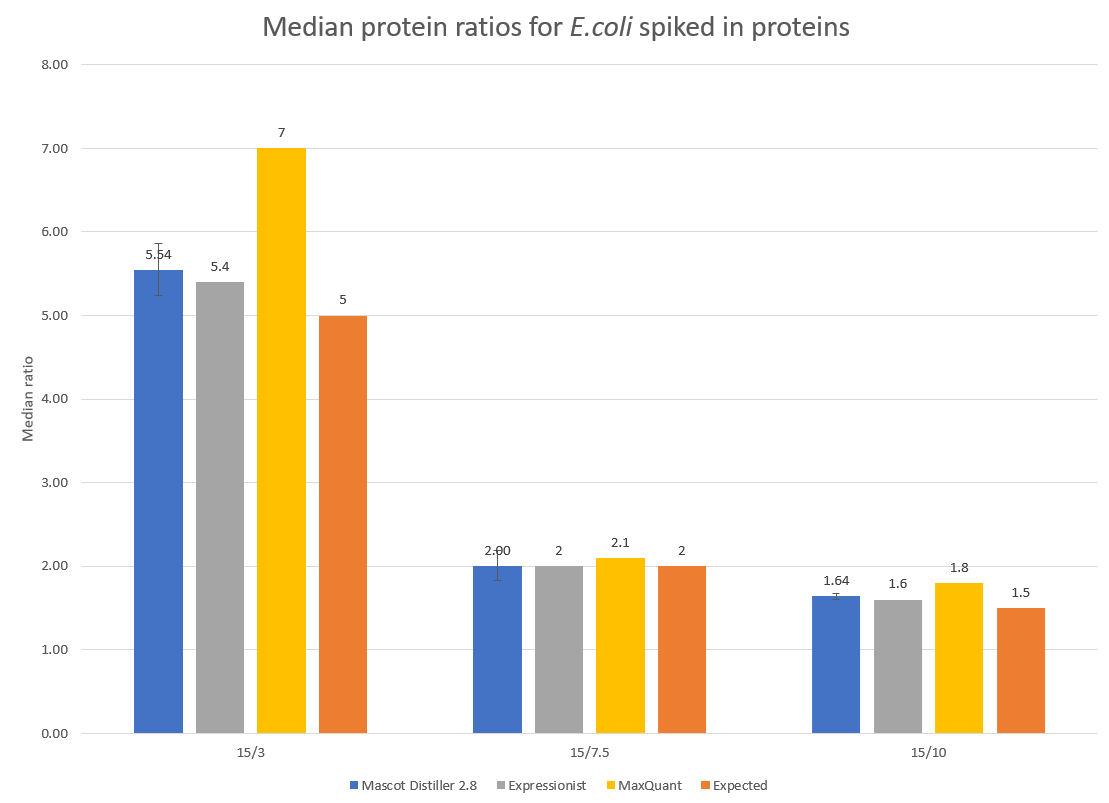
To examine the accuracy of quantitation, the median protein ratios for the E.coli identified proteins with two or more quantified peptide matches were calculated for each of the target ratios of 5, 2 and 1.5. The results are presented in Figure 2 below:
Click to view full size image
Figure 2: Detected and expected ratios for the spiked in E.coli proteins. Error bars show 95% confidence intervals. Median values for Expressionist and MaxQuant are shown for comparison and have been taken from Shalit et al.1 and is equivalent to figure 8d in that paper.
We are therefore seeing good accuracy and reproducibility from label-free quantitation in Mascot Distiller 2.8, alongside improvements in speed and memory usage compared with older versions of the software.
If you already have a licence for Mascot Distiller, then 2.8 is a free update. If not, and you’d to evaluate it, we offer a 30 day trial of Mascot Distiller. For details, please see http://www.matrixscience.com/distiller_download.html
Reference
- Shalit T, Elinger D, Savidor A, Gabashvili A, Levin Y. J. Proteome Res. 2015, 14, 1979-1986
Keywords: global time-alignment, label-free, Mascot Distiller, quantitation, replicate, retention time