Back to basics 3: Quantitation statistics
Mascot Server and Distiller support a number of different quantitation methods. These methods are carried out at the peptide level, the peptides are then grouped into protein families, and the peptide quantitation results used to calculate protein ratio values. Mascot and Distiller perform a number of statistical procedures and tests to give you an indication of the quality and reliability of your results. Therefore, to get the best from your data, it is important to understand what these tests are, and what they tell you.
To examine some of these factors, we’ll be taking a look at some results from a TMT 6-plex experiment, where the single reported ratio is the sum of the 129,130 and 131 channels divided by the sum of the 126, 127 and 127 channels.
Significance test
In a quantitation experiment, you’re usually looking for proteins which have significantly changed abundance compared to a control sample. To test whether a protein ratio is significantly changed, Mascot and Mascot Distiller carry out a one sample Student’s t-test. A one sample t-test is a statistical test used to compare the mean of a sample population against a hypothetical value specified in a null hypothesis. If the calculated p-value from the t-test is below a specified significance threshold, the null hypothesis is rejected. The null hypothesis used by Mascot is that the true ratio value is 1 and any difference between the observed value and 1 is due to experimental or sampling error, with a significance threshold of 0.05. Protein ratios which are significantly different from 1, where the null hypothesis has been rejected, are shown in bold face on the Mascot reports, an example of this is shown in Figure 1 below:
Click to view full size image
Figure 1: A protein ratio showing a significant change, in this case a significant decrease in the amount of the protein between the test and control samples.
The ratio tooltip gives us some further useful information about the ratio. N is the sample size used to calculate the protein ratio, p-value is the result of the t-test, and SD(geo) is the geometric standard deviation (see below). More details on how the test is carried out can be found on our help pages here.
Fold change and standard deviation, or why isn’t my protein ratio significant?
Standard deviation is a measure of the amount of variation in a dataset. A low standard deviation suggests that there is relatively little variation in the sample population, with values tending to be close to the mean, while a large standard deviation suggests that the data are spread out over a larger range. Because peptide ratio distributions are log-normal, Mascot and Mascot Distiller report the geometric standard deviation for protein ratios. The geometric standard deviation is a factor, not a difference. In other words, the lower value for the confidence interval is obtained by dividing the protein ratio value by the standard deviation, and the upper value by multiplying the protein ratio value by the standard deviation, which is never less than 1.0.
A protein ratio with a high standard deviation therefore indicates that there is a high degree of variability in the peptide ratio values assigned to it. The higher the degree of variability, the less likely it is to get a significant result. The variability could be due to measurement artifacts, incorrect (peptide) assignments or shared peptides from proteins that have a different ratios, amongst other reasons.
Figure 2 shows a protein with a ratio of 0.801. The results contain 15 other protein hits with a similar ratio value which are reported as significantly changed, but the protein ratio is not being shown as significant:

Click to view full size image
Figure 2: A non significant protein ratio with a high standard deviation.
If we look at the tooltip for this hit, we can see the sample has a high SD(geo) reported. In other words, there is a large amount of variation in the peptide ratios assigned to this protein. The actual ratio value could be anywhere in the confidence interval between 0.49 and 1.3 and the t-test null hypothesis cannot be rejected.
Testing for normality, or why is my ratio in italics?
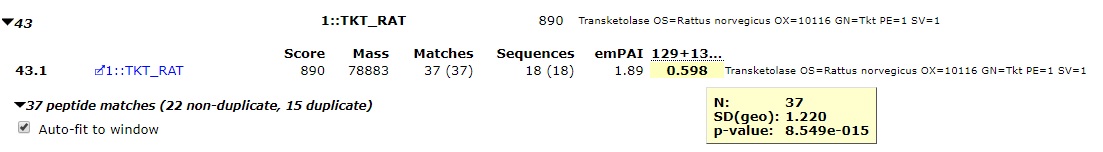
The Student’s t-test used to test for significantly altered protein ratios makes the assumption that the log values of the test population have a normal distribution. To test this assumption, Mascot carries out a Shapiro-Wilk W-test on the peptide ratios assigned to each protein, with the null hypothesis that the peptide ratio samples are taken from a normal distribution. This test is valid for sample sizes between 3 and 2000, so if you have a very large number of peptide ratios assigned to a protein hit it will automatically fail. Protein ratios which have failed the test are shown in italic on the reports to indicate that while the ratio may be of interest, you should look in more detail at it. Figure 3 below gives an example of this:

Click to view full size image
Figure 3: A protein ratio calculated from a non-normal peptide ratio distribution.
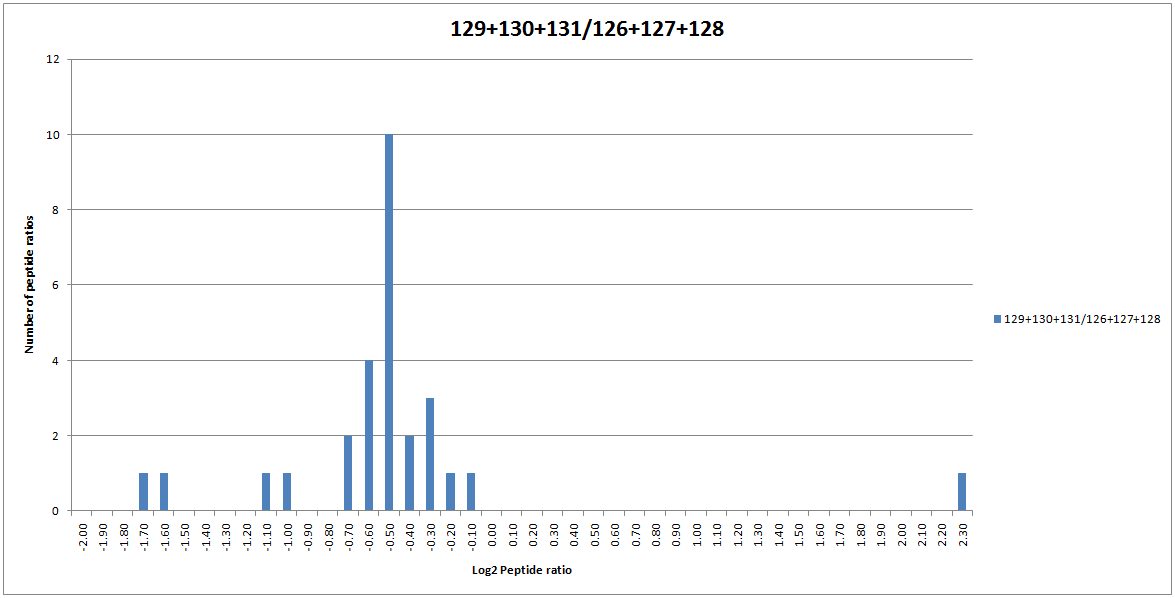
As you can see from Figure 3, when a protein ratio fails the Shapiro-Wilk W-test, we still report the t-test p and the SD values. If we plot out the peptide ratio values used to calculate the ratio, we can see that the tails of the distribution are extend with three outlier ratios, and this is probably why the W-test is failing.
Outlier removal
The peptide ratios assigned to SERA_RAT above would probably pass the W-Test but for the obvious outlier ratios at the extreme tails of the distribution. In Mascot and Mascot Distiller, three outlier removal methods are available (Dixon’s, Grubbs’ and Rosner’s), with a fourth option to automatically choose the best method based on the sample size. Detailed descriptions of these methods can be found here.
Blindly using and accepting the results of automatic outlier removal is not recommended. Instead, try calculating the ratios with and without outlier removal enabled and seeing if it has a noticeable effect. If we turn on automatic outlier removal for our dataset, the peptide ratio distribution for SERA_RAT is now normal as the 3 outlier ratios have been automatically removed from the protein ratio calculation:
Click to view full size image
Figure 4: The distribution of peptide ratios assigned to SERA_RAT.
Because the peptide ratio distribution is now normal, the ratio is being displayed as significant in bold face.

Click to view full size image
Figure 5: The SERA_RAT protein ratio calculated with outlier removal enabled.
Normalising ratios
When calculating protein ratios, Mascot and Mascot Distiller both offer the option to normalise the calculated protein ratios. Normalisation is a way to reduce systematic errors. If you perform normalisation, this forces the mean or median ratio (depending on the selected protein ratio calculation method) for all peptides to 1. The effect of this can be clearly seen on the peptide ratio distribution for the matches to SERA_RAT, as shown in Figure 6 below:
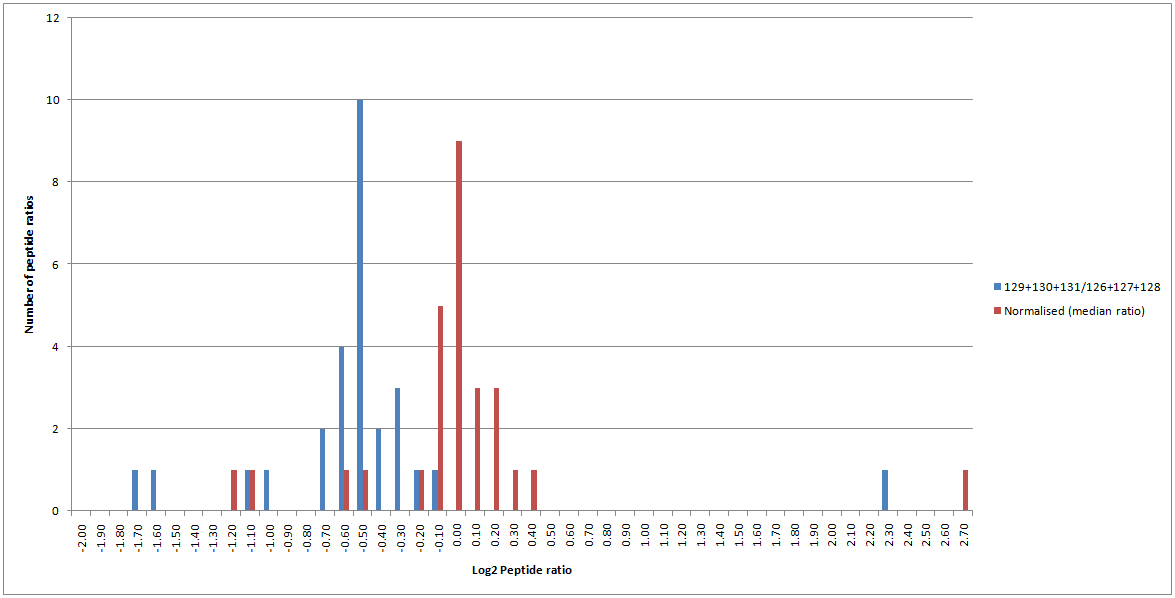
Click to view full size image
Figure 6: Peptide ratio distribution for matches to SERA_RAT with (red) and without (blue) normalisation enabled.
Therefore, normalisation can cause a significant change to the calculated ratios and it is very important to think about when it should and should not be enabled. If the mean or median peptide ratio is supposed to be 1, then enabling normalisation is the correct thing to do as it will reduce systematic errors from sample processing (for example, errors caused by incorrect labelling, loading or mixing of your samples). In other cases, it is the wrong thing to do – for example, if you’re analysing a dilution series where the ratio is supposed to be 4:1, you wouldn’t want to force it to be 1:1.
In this experimental dataset, the sample loadings and labelling should have been equal and the majority of proteins were expected to be unchanged. Therefore, the average peptide ratio is expected to be 1; with only a limited number of proteins being changed compared with the control. Therefore, enabling normalisation is the correct thing to do in this case. This changes the calculated median ratio for SERA_RAT to 0.948, and it is no longer flagged as significantly changed between the control and test conditions.
From Mascot 2.5 onwards, in addition to global normalisation, you can specify multiple protein accessions or peptide sequences to normalise to. These would normally be spiked into the sample for this purpose, and the normalisation factor used is then calculated from either the specified protein or peptide ratios.
Exporting the results
Finally, once you’ve got your quantitation calculation settings correct, you’ll often want to export a list of proteins with significant ratio fold changes. This can be done very easily using the Report Builder, filtering on the ratio p-value. You can also include a column which shows whether or not the protein ratio has a normal distribution, flagging potential proteins of interest where you may need to carry out some further validation. For our test dataset, this quickly enables us to generate a table of 235 protein hits of interest, which can then be easily exported to Excel as a CSV file. You can find more information about the report builder here.
Keywords: normality, outlier, quantitation, significance, statistics, t-test, tutorial