How Mascot Insight uses gene ontology and molecular interaction data
The identification of the proteins and peptides in a sample is often just the first step in a wider investigation. You may want to annotate results with details of the known functions and interactions of the proteins identified, helping answer biological questions such as ‘Do my cancer samples contain more than the expected numbers of proteins involved in cell proliferation?’, or ‘How many know interactors does this protein of interest have?’
There are many resources available which contain this type of information and which can be used in Mascot Insight to annotate your results. One of the best known is the Gene Ontology (GO) resource. GO is a controlled vocabulary which provides a consistent way of describing protein function and cellular localisation. Another class of resources are the molecular interactions databases, which contain details of protein-protein interactions, such as BioGRID and IntAct.
GO annotations
You can enable and view GO annotations for protein hits in the Mascot Insight Results Applet (MIRA), which is the main data viewer in Mascot Insight. GO assignments are made to protein hits using the GO mapping file curated by the EBI. This enables assignments to be made to any protein hit where mapping to the UniProt accession is available (including matches to NCBInr/RefSeq). Once enabled, GO annotations are shown in the Proteins table in MIRA as coloured dots. Each cell has a tooltip with further details:
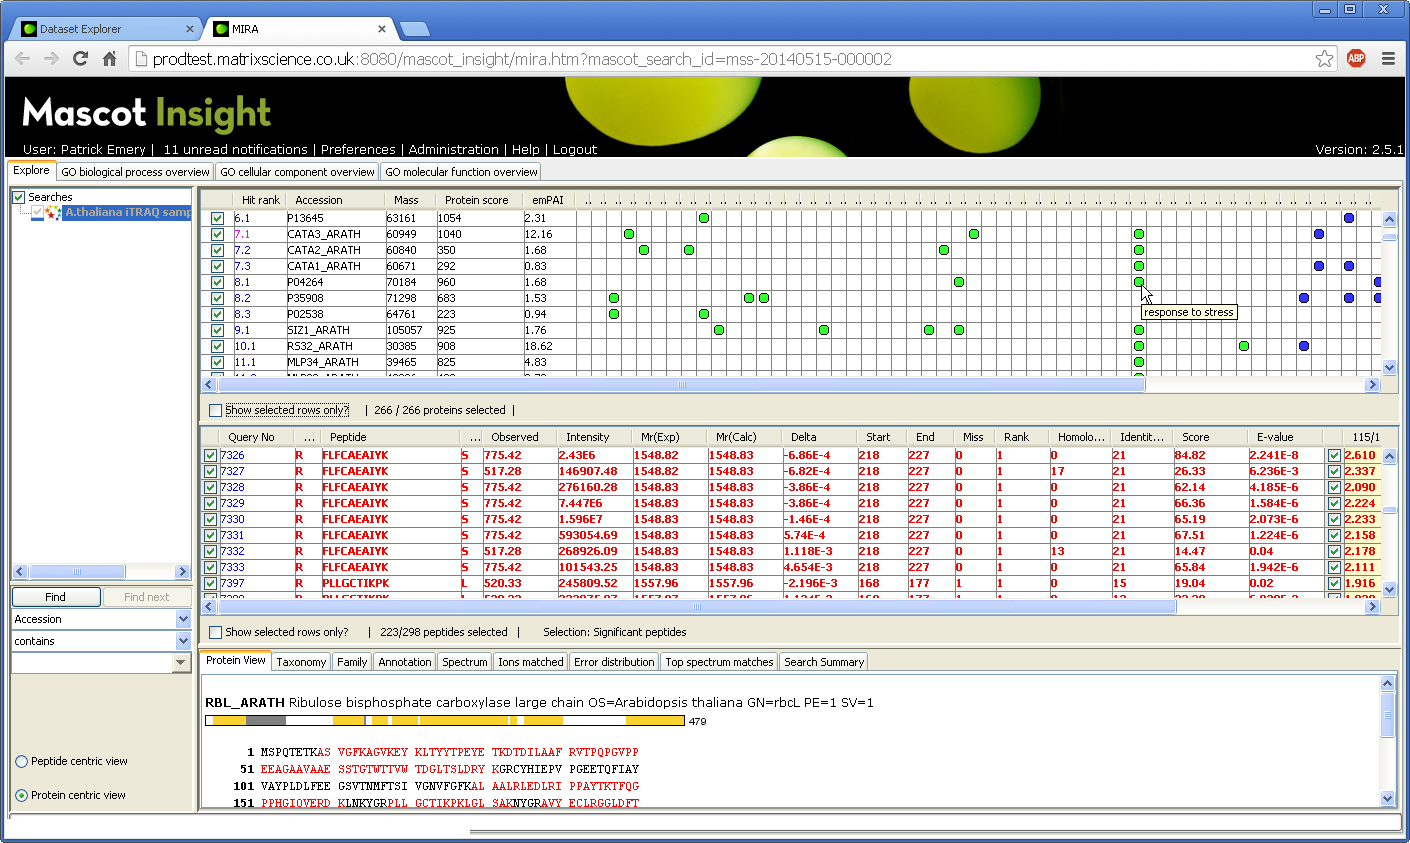 Click to view full size image
GO assignments can also be viewed as pie-charts:
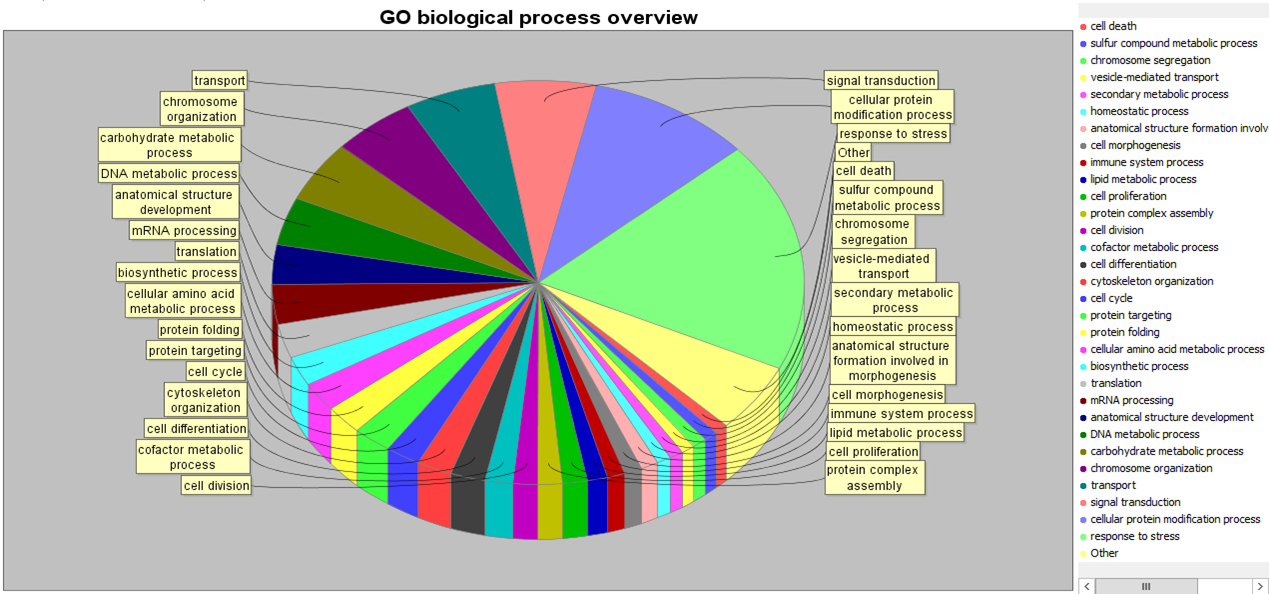 Click to view full size image
Clicking on a section of the pie chart filters the selected proteins on that GO assignment. This can be combined with other filters available in the system. For example, you could filter the protein selection to exclude matches to a contaminants database and include only protein matches involved in cell division which have a quantitation fold change greater than 1.5.
In addition to these views, there are several reports in MIRA to examine GO assignments. One of the most useful compares the GO assignments from your dataset against those for a selected UniProt proteome. GO term frequencies are calculated for both the proteome and the proteins. For each GO term, the frequency of the term from the search result minus the frequency from the proteome is plotted; optionally filtering the dataset to only show GO terms where there is a significant difference between the dataset and the proteome. Therefore, GO terms enriched in the search result have a positive value whilst depleted terms have a negative value. In the example below, I’ve comparing three technical replicates from a human lung cancer xenograft to the UniProt human proteome. From the plot, you can easily see that there is an enrichment of proteins involved in gene expression, and a depletion of proteins involved in the regulation of cell communication in the sample when compared with the proteome:
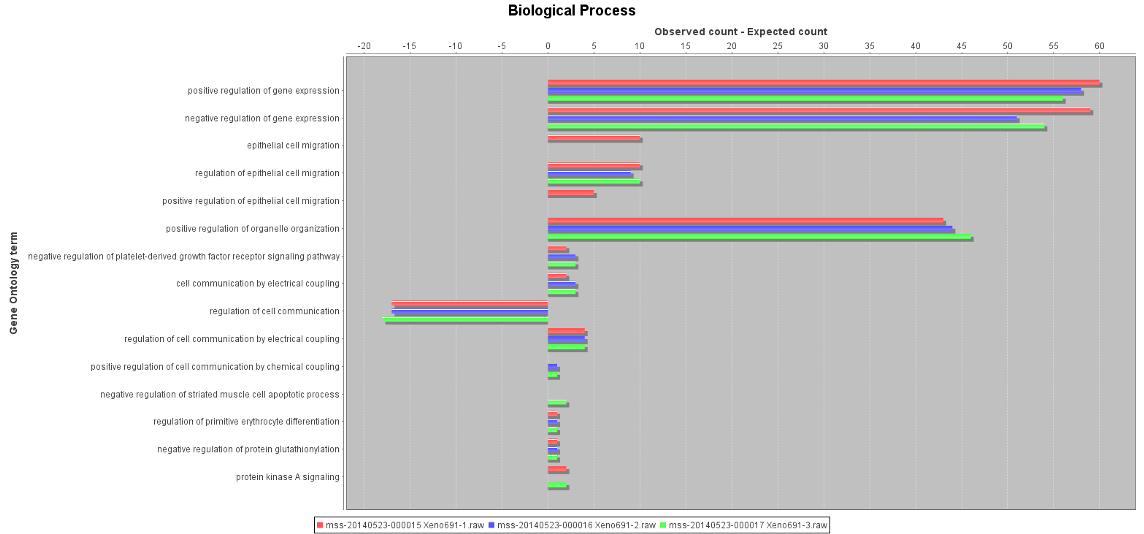 Click to view full size image
Once the reports have been generated, they can be exported in a number of graphical formats for use in your own reporting including the SVG standard format. The underlying graph data can also be exported as a CSV file, so you can easily import it into another package such as Excel.
Using Molecular Interactions Databases
Mascot Insight can access any molecular interactions database that is available in the HUPO PSI-MITAB standard format. Protein accessions from your search results are cross-referenced with the database entries either using UniProt accessions or, if the interactions database has one, a separate lookup file (for example, when using the BioGRID database).
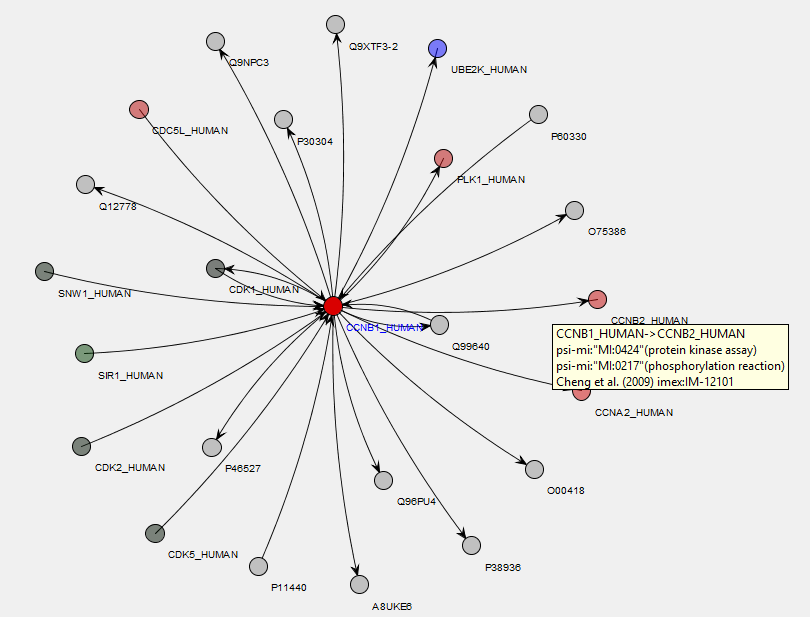
Within MIRA, there is a report which finds all of the interacting proteins from a selected molecular interaction database for a protein selected from the search result, with the results shown on a network diagram. In the example below, we’re looking at proteins which interact with human Cyclin B1 using the IntAct database. Proteins identified in the search result are highlighted in blue and, from the network diagram, you can quickly see that we’ve identified approximately half of the proteins listed in IntAct as interacting with Cyclin B1 in our sample:
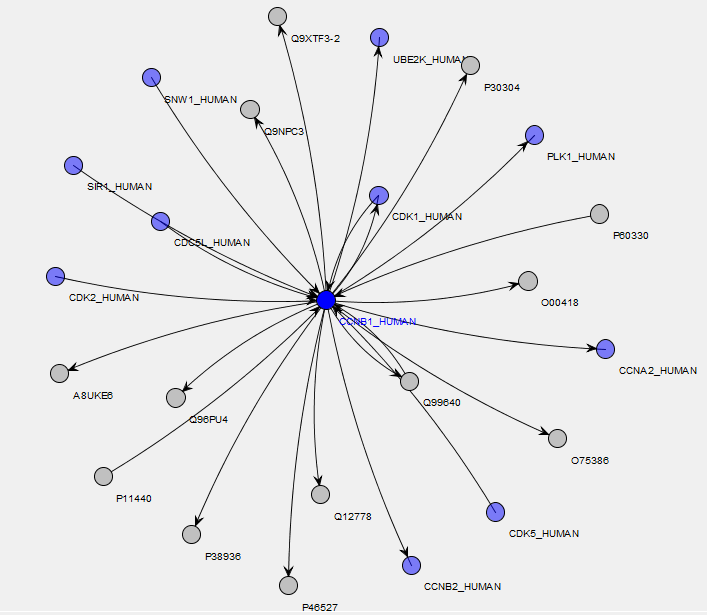 Click to view full size image
Placing the mouse over a node or connection on the map brings up a tooltip showing information about the protein or interaction. The search result is taken from a cell-cycle arrest and release experiment with different stages of the cell-cycle quantified using iTRAQ 4-Plex. Here, the 117/114 ratio values (Prometaphase/G1 protein levels in this experiment) have been overlayed on the network as a heatmap, so we can easily see how the protein ratio values for the identified interactors compare with each other:
 Click to view full size image
Clicking on a protein node expands the interaction map to include the interactions of the selected protein.
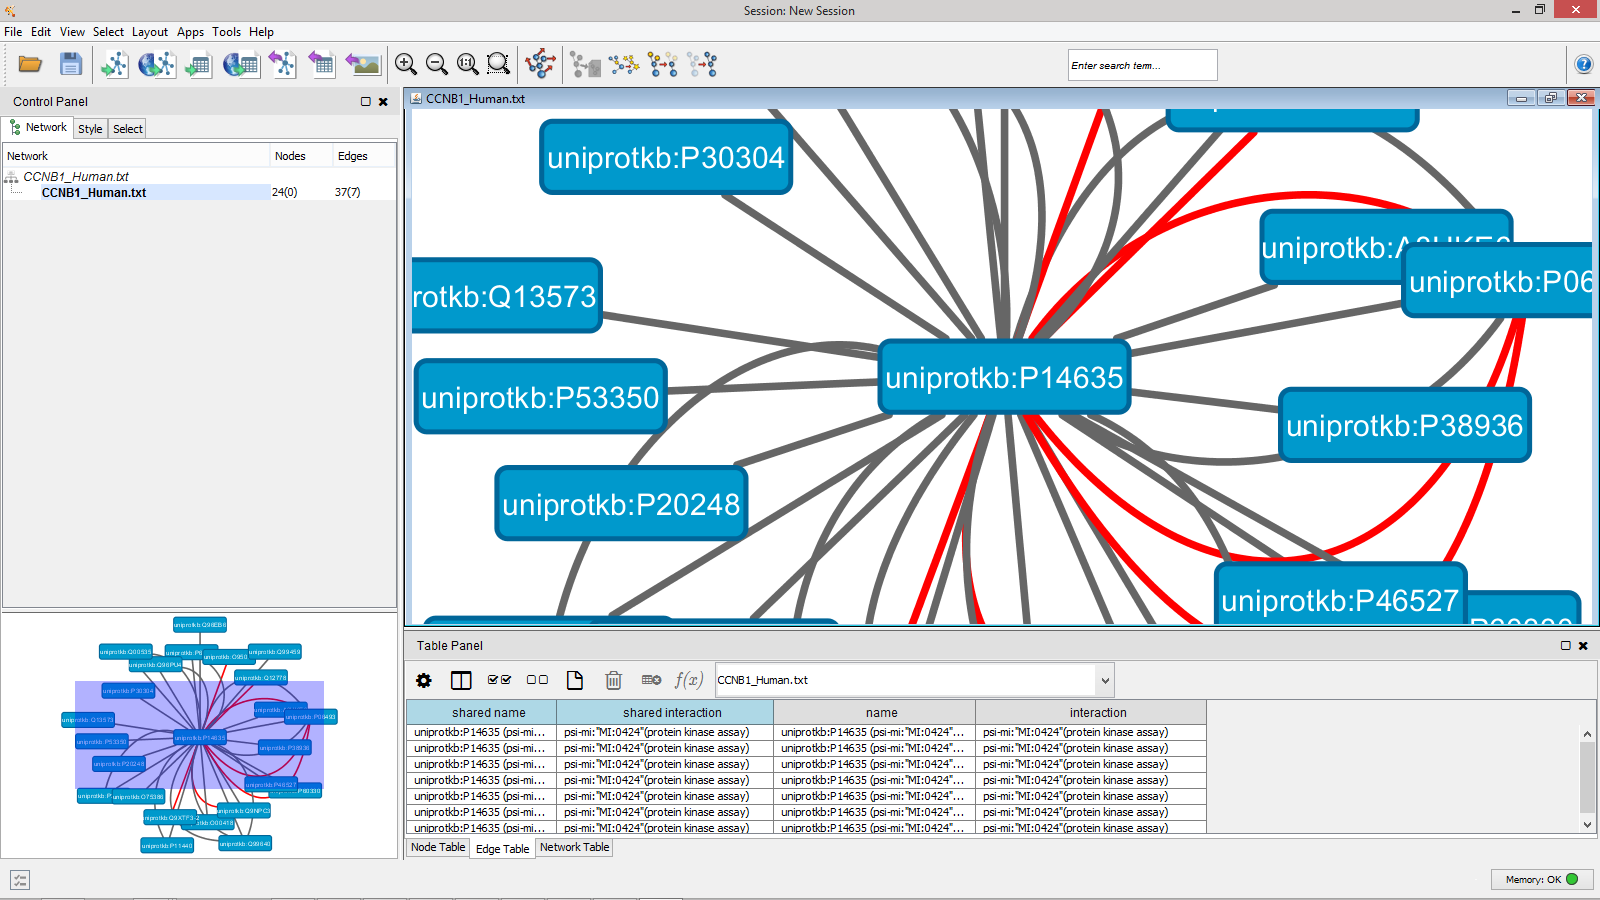
Once you’ve built the network map of interactions you’re interested in, the image can be exported as either a bitmap image or an SVG vector file. You can also export the data as a PSI-MITAB format text file for use in other packages, such as the popular Cytoscape package.
 Click to view full size image
The exported file includes the overlay information shown in MIRA as additional fields, so information about which proteins were identified in your search result is included in the export, along with any quantification data being displayed.
Your own reports
Mascot Insight has a flexible Java API which allows you to write your own reports. These can either be interactive reports which run within MIRA, or they can be ‘export’ reports – allowing you to generate an export file in any format you choose. You can access both GO and interaction database data using the API, allowing you to easily create your own reports using these resources.
Keywords: gene ontology, molecular interaction