Back to basics 5: Peptide-spectrum match statistics
Mascot can identify peptides in uninterpreted MS/MS data. Observed spectra are submitted to Mascot as search queries. A query specifies the precursor ion m/z and charge state as well as the MS/MS peak list. Mascot digests protein sequences from the chosen database and selects peptide sequences whose mass is within the specified tolerance of the query’s precursor mass. The software calculates predicted peptide fragment masses and matches these to the observed MS/MS peaks, and the match is given a score.
The peptide-spectrum match (PSM) score is -10log10(p), where the p-value is the probability that the match has occurred by chance. A score near zero (p-value near one) is uninteresting, while a very high score (p-value near zero) is evidence that the match did not occur by chance. But how does Mascot draw the line between low and high scores?
Hypothesis testing
Mascot’s statistical model uses classical (“frequentist”) hypothesis testing. This starts with a null hypothesis: the sequence being matched to the spectrum is an unrelated sequence. The p-value is the probability of getting the observed number of matching fragment peaks assuming the null hypothesis is true (this is what “occurred by chance” means). The hypothesis test compares the p-value with the predefined significance level, often called alpha, which by default is 0.05. If the p-value is less than alpha, we say there is statistically significant evidence against the null hypothesis and the null hypothesis should be rejected. In other words, we’ve made a discovery.
It’s important to keep in mind that a statistically significant sequence is not necessarily the true sequence; it could be a homologous sequence or a mild permutation of the true sequence. Rejecting the null hypothesis simply means the sequence fits the observed data unexpectedly well.

A hypothesis test can make two kinds of errors: reject the null hypothesis when it is true (false positive, type I error); or accept the null hypothesis when it is false (false negative, type II error). The significance level determines the upper bound for the type I error rate. This is the probability of a false positive match if the experiment were repeated numerous times. There’s no parameter for the type II error rate in Mascot, because there is a large number of possible alternative hypotheses, such as “the sequence is NISQSFTNFSK” or “the sequence is SEDVLAQSPLSK”. The type II error rate can only be determined for a specific alternative hypothesis.
Two sides of the expect value
So far, we’ve discussed the hypothesis test with a single peptide sequence. But a query hardly ever has just one sequence within precursor tolerance, and variable modifications can greatly increase the number of trials. The more trials you do, the more likely you are to see an incorrect match with an extreme score.
The family-wise error rate (FWER) is the probability of getting at least one false positive match when you do multiple hypothesis tests at a fixed significance level. Mascot score thresholds are designed to control the FWER within a query. Thus, if a PSM score exceeds the score threshold in the query, we can be sure the FWER is less than the predefined significance level, alpha. For example, if alpha is 0.05, a score above threshold has at most 5% chance of being false positive.
The significance test is summarised by the expect value, which is a function of the score and the threshold. A match must have expect value less than alpha to be significant. When the expect value is greater than one, it is the expected number of times of observing a score at least as extreme, assuming all null hypotheses are true. When the expect value is much less than 1, it approximates the FWER-controlled p-value. That is, the “raw” p-value is corrected for multiple testing and reported as the expect value, so that we can use the familiar and simpler hypothesis test.
Calibrate the error rate with decoy search
The key modeling assumption is that all null hypotheses are true. In other words, we assume all of the peptide sequences within precursor tolerance are random, so-called true nulls. Obviously this is not strictly true in a real search, where the database is chosen with the goal that the majority of spectra have at least one “correct” sequence within precursor tolerance. The model is robust and handles it well as long as the proportion of true nulls remains high. However, a very narrow precursor tolerance can easily tilt the balance.
Another assumption is that the sequences are statistically independent. This isn’t always true. For example, when the database is large enough or contains highly homologous proteins, it’s possible to get clusters of peptide sequences that only differ by a small mutation. PSM scores for these peptides will be correlated, which can skew the distribution of p-values within a query.
The best guard against deviations from model assumptions is to calibrate the model using a target-decoy search. This means searching the MS/MS spectra using the same search conditions against a decoy database that contains only incorrect peptide sequences. The number of significant decoy PSMs gives an estimate of the false discovery rate (FDR), which is the proportion of false positives among all statistically significant PSMs.
The FDR is a property of the data set, while the FWER is a property of an individual query. The two are connected by the significance threshold alpha. If the data set follows the modeling assumptions perfectly, the FDR is equal to the significance level alpha. This is because alpha specifies the type I error rate, which is the probability of getting false positives (decoy PSMs). When the two differ, the significance level can be adjusted to yield a suitable FDR.
For example, the iPRG2008 Mouse search has FDR 7.73% at the default significance level 0.05:
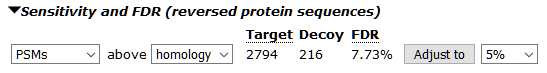
Adjust the FDR to 5% and the significance level is changed to 0.0359. The statistical assumptions are reasonably well satistifed in this data set, although the significance test has a bit higher false positive rate than intended.
On the other hand, the example iTRAQ 8-plex search has FDR 1.36% at the default significance level:
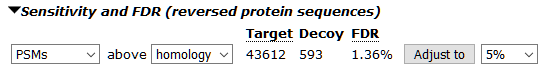
The significance test is clearly far too conservative in this data set. It’s likely down to the high quality of the peak lists and the 20ppm precursor tolerance.
Keywords: FDR, scoring, statistics, tutorial