Tabulate expression data from multiple analyses with Mascot Daemon
Studies that use mass spectrometry-based quantitation often contain large numbers of individual analyses: samples from different sources or treatments or time points, possibly fractionated, with replicates and so forth. Using statistical methods to combine the analyses, extract meaningful information, and report it as charts and tables is a complex task that usually requires custom scripting in a language such as R or specialised software such as Perseus. These require input in spreadsheet form, called a Quantitation Summary, where the rows correspond to proteins and the columns contain expression data for the various samples in the form of abundances or ratios of abundances.
The facility to create such a spreadsheet is a new feature in Mascot Daemon 2.7. Both label-free and isotopic label quantitation methods are supported, including reporter ion methods. This article describes the mechanics of selecting the files and annotating the expression information. A future article will give examples of using the summary to create reports and charts.
Mascot Daemon processes raw files in batches using one or more tasks. Each raw file is peak picked, the peak list is searched using Mascot Server to identify peptides, and the peptides are then quantified. Transforming the data from a collection of individual files into a Quantitation Summary requires the files to be annotated using a Sample Map. The process of creating a Sample Map and exporting a Quantitation Summary can be described most clearly by means of an example.
A set of 12 raw files was downloaded from PRIDE project PXD001385. According to the project description: "Four groups of samples, called 3, 7.5, 10 and 15 were prepared in three replicates. The numbers indicate the amount of E. Coli (in nanograms) spike[d] into 200ng HeLa digestion, which was loaded onto the LC column for each sample. This simulated 5, 2 and 1.5 fold changes relative to the 15ng sample."
The files were processed in a single Mascot Daemon task, using Mascot Distiller for peak picking and quantitation. The data were searched against human and E. coli proteomes plus a contaminants database using typical search settings for Thermo Q Exactive data. The quantitation method was Average [MD], which is label-free quantitation for individual files. Once processing was complete, the task was selected in the list view on the Mascot Daemon status tab. Right clicking the selection invoked a context menu, from which Quantitation Summary; New sample map … was chosen. The following window was displayed:
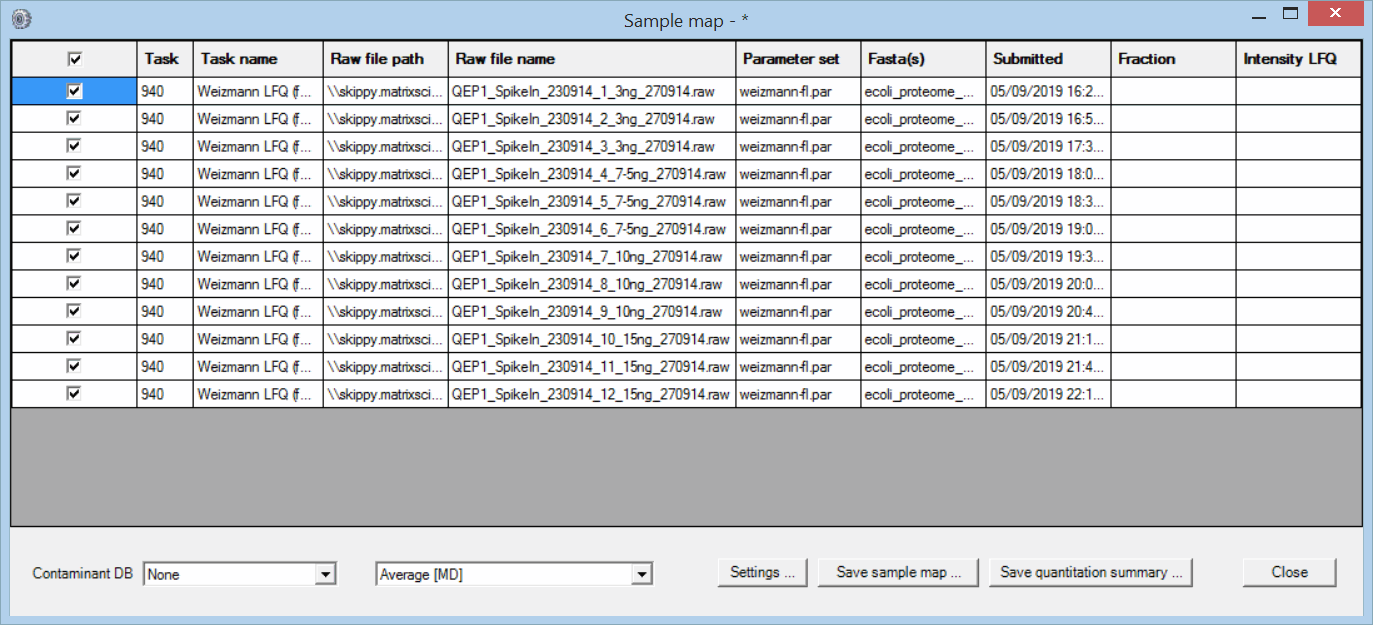
The purpose of the Sample Map is to annotate a collection of result files from one or more tasks with recognisable sample identifiers. For example, imagine a label-free study of 6 biological samples, 3 control and 3 treated, each of which has been analysed at 4 time points in 3 technical replicates and each replicate has been separated into 6 fractions prior to analysis. This would result in 432 files, probably spread across multiple Daemon tasks. In order to answer a question such as "Are fold changes in certain proteins between control and treated at a certain time point greater than between technical replicates?", we need to assign identifiers to the files that allow them to be categorised for further processing.
The Sample Map table can be sorted to make it as efficient as possible to add sample identifiers. In this case, sorting on raw file name (by clicking the column header) is all that is required. For more complex data sets, sorting on file path or task name or time of submission may help organise the files in a useful way. This is particularly important when samples have been separated into large numbers of fractions. You don’t want to have to type in every fraction number. Just sort appropriately, select the cell range in the fraction column, right click and choose Fill with integer series.
If a sample is not fractionated, the fraction cells can be left empty, unless you wish to merge replicates by treating them as fractions. In this example, there are two useful ways to fill in the two columns on the right that are used to identify the samples:
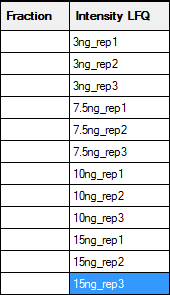
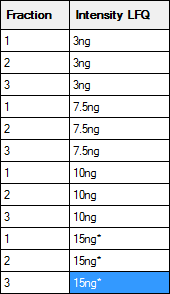
The left hand map will create separate columns in the Quantitation Summary for each replicate; useful if you want statistics for variation across replicates. The right hand map will merge the replicates as if they were fractions. An asterisk indicates the reference or control sample, and the Quantitation Summary will include ratios relative to this sample. Otherwise, the labels are arbitrary strings, and could be any combination of printable characters, provided that the combination of identifiers in the Fraction and Intensity LFQ columns is unique for each row. A context menu provides spreadsheet-style copy and paste functions to minimise typing.
The Sample Map can be saved to a disk file, even if not complete, and reloaded as required. When Save quantitation summary … is chosen, some validation is performed. If all is present and correct, a Quantitation Summary is created, which is a text file that can be opened in any spreadsheet application or text editor.
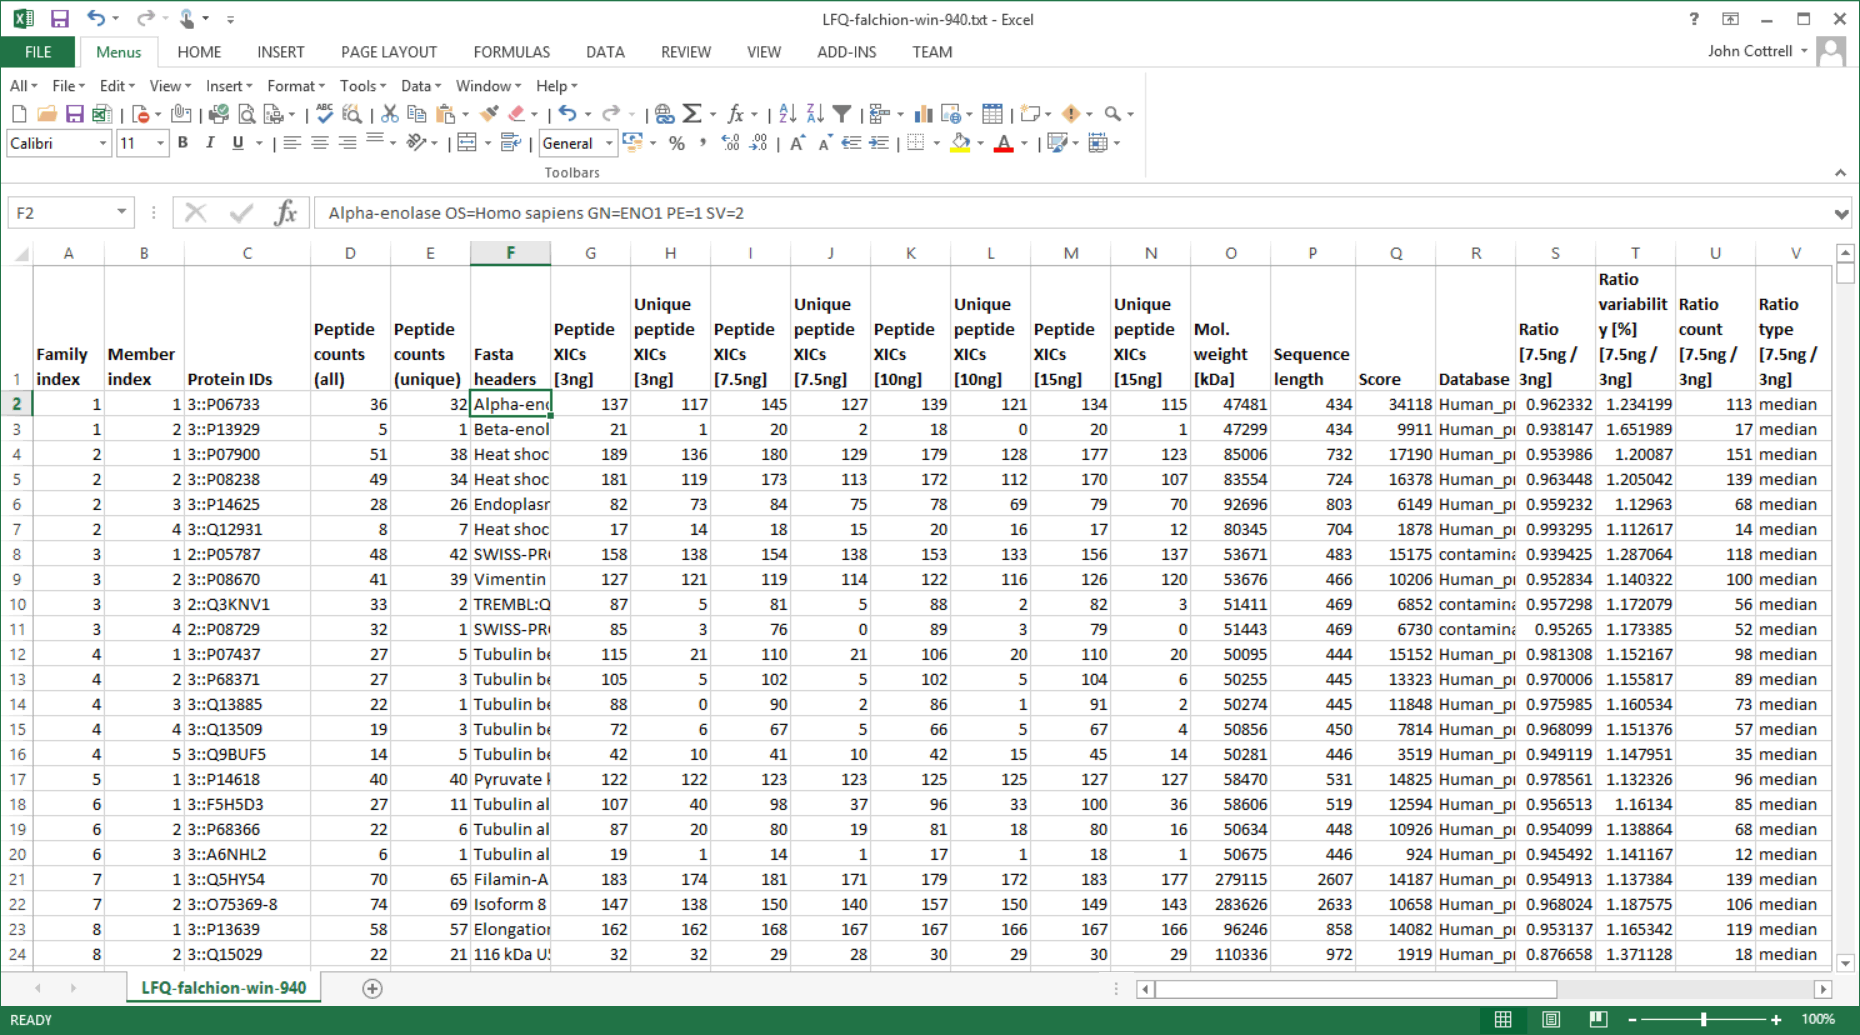
One of the strengths of the Quantitation Summary is that it uses the same rigorous protein inference as the Mascot Protein Family Summary report. Full details and reference material can be found in the Mascot Daemon help. A future article will give examples of using the summary to create reports and charts.
Keywords: export, Mascot Daemon, Mascot Distiller, quantitation, statistics, tutorial