Probabilistic spectrum-centric scoring for DIA
In DIA analysis, it feels like far too much attention is devoted to maximising the number of identified proteins and too little on the quality of results. We’re working on a universal spectrum-centric solution for the analysis of DIA data, called Mascot DIA. The key focus is on using all the peak information in the MS/MS scan, without prior assumptions about fragmentation patterns. Spectrum-centric searching combined with probabilistic scoring of fragment mass matches leads to high-confidence peptide identifications.
How Mascot DIA works
Mascot is spectrum-centric. The difference to peptide-centric analysis is explained in The promise of spectrum-centric DIA, and a diagram of the workflow is shown below.
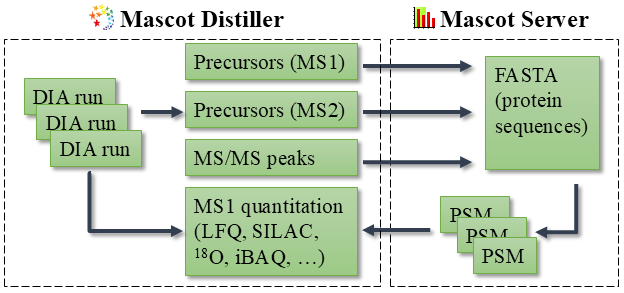
The database search starts from a protein sequence database. Mascot digests the sequences into peptides and calculates theoretical fragment masses, such as b and y ion series. It doesn’t need to predict peak intensities.
In the next step, the algorithm progressively selects observed peaks from the MS/MS scan, highest-intensity peaks first, and counts several metrics such as: number of matches in each ion series (a, b, c, x, y, z+1, …); number of matched residues; and number of unmatched peaks.
Finally, Mascot calculates the probability (p-value) of observing these counts under a null hypothesis: that the peptide match is unrelated to the MS/MS spectrum. This means it’s really modeling ‘noise’ and reckoning how many matches you can have at random, until the pattern no longer looks random. As there are usually hundreds to thousands of candidate sequences per spectrum, the p-value is corrected for multiple testing, and this is reported as the Expect value.
Why bother with probabilistic scoring?
Probabilistic spectrum-centric scoring has two key benefits:
All the information in the MS/MS spectrum is used. A peptide with just 3-5 matching fragments is a random match (p-value = 1.0). In order to get a statistically significant score, a peptide has to have decent sequence coverage, which means every relevant peak is used. Mascot will also look for neutral loss series (like y-H2O and b-NH3) and fragment NL peaks. These all increase the confidence that the correct match has been found.
Spectrum-centric analysis can be independent of fragment intensity predictions. In fact, Mascot probabilistic scoring doesn’t need predicted intensities at all. It just uses observed peak intensities when selecting peaks for scoring. This means it’s immune to changes in intensities (such as presence of heavy variable modifications) and randomly missing peaks (such as neutral losses) as long as there is sufficient residue coverage.
Importantly, note that Mascot DIA does not have to deconvolute spectra along the time axis or create pseudo-DDA projections. It matches fragments from multiple peptides directly into the original MS/MS scan. If a peptide has fragmented well, then its fragments are all contained within an MS/MS scan and there is no need to look in adjacent scans. Just match and score the observed fragments.
If the peptide hasn’t fragmented well, then you may get a handful of fragment peaks that are mixed with noise and unrelated peptides. Very complicated algorithms and machine learning approaches have been devised to identify those peptides. By design, probabilistic scoring will not identify a poorly fragmented peptide, so it is more robust against false positives.
Is this only for narrow-window DIA?
Spectrum-centric searching in general is only a useful strategy with narrow-window DIA. By narrow, we mean 2-8Th isolation windows. If the data are already sparse (e.g. single cell) or an additional dimension of separation is used (e.g. ion mobility), then a wider isolation window may be fine.
Our contention is that as instrumentation improves, isolation windows are becoming narrower, which reduces spectral complexity. As long ago as 2018, Ludwig et al. predicted that DIA algorithms will eventually converge with DDA algorithms. We are now at a point where narrow-window DIA is commonplace, so analysing DIA spectra no longer requires complex neural networks or DDA spectral libraries.
Recent developments with Thermo Orbitrap Astral instruments suggest a push towards very short gradients. Peptide-centric searching typically uses information from adjacent scans as it follows the elution profile of fragment peaks. When the gradient is 15 minutes or shorter, a peptide may only be observed in one or two scan cycles. Will peptide-centric searching survive if there are only one or two observations per fragment? What about direct infusion DIA where LC is omitted entirely?
So, we have optimised the probability model for DIA in two ways: the noise model has been redesigned to better account for peaks from unrelated peptides; and all aspects of the model have been reviewed to take advantage of modern instruments with high mass accuracy.
SCIEX TripleTOF 6600+, SWATH, narrow window
Let’s leap directly into real data.
The example shown below comes from the excellent DIA benchmarking data set by Puyvelde et al. (2022), PXD028375. We arbitrarily selected LFQ_TTOF6600_SWATH_Condition_A_Sample_Alpha_01.wiff, which was acquired on SCIEX TripleTOF 6600+ using SWATH 99 variable windows. The windows are mostly 6-7Th wide, increasing to 12Th at the upper mass end. The cycle time is 4s (250ms for MS scan, then 37.5ms for MS/MS scan) and the gradient is 2h. (The windowing scheme is specified in supplementary table S3 of the publication.)
We processed the raw file into chimeric peak lists using a beta version of Mascot Distiller (with new precursor detection), then searched the spectra using Mascot Server 3.1 with DDA scoring, and a beta version using the new DIA scoring model. All other parameters were identical, such as databases, fragment tolerance and instrument type. The high-level identification counts are summarised in the table below.
| Scoring | PSMs | Sequences | Protein hits |
|---|---|---|---|
| Mascot 3.1 (DDA) | 41,204 (0.49% PSM FDR) | 9,230 (1% seq FDR) | 2,070 |
| Mascot 3.2 beta (DIA) | 73,068 (0.33% PSM FDR) | 15,728 (1% seq FDR) | 3,136 |
Improvements to the noise model lead to almost double the number of statistically significant peptide matches at the same sequence FDR. Because the isolation windows are quite narrow, and the gradient is quite long, the spectra aren’t very complex. Many of them look like DDA spectra with fragments from just one or two peptides. Below is MS/MS scan 103104 before and after database searching.
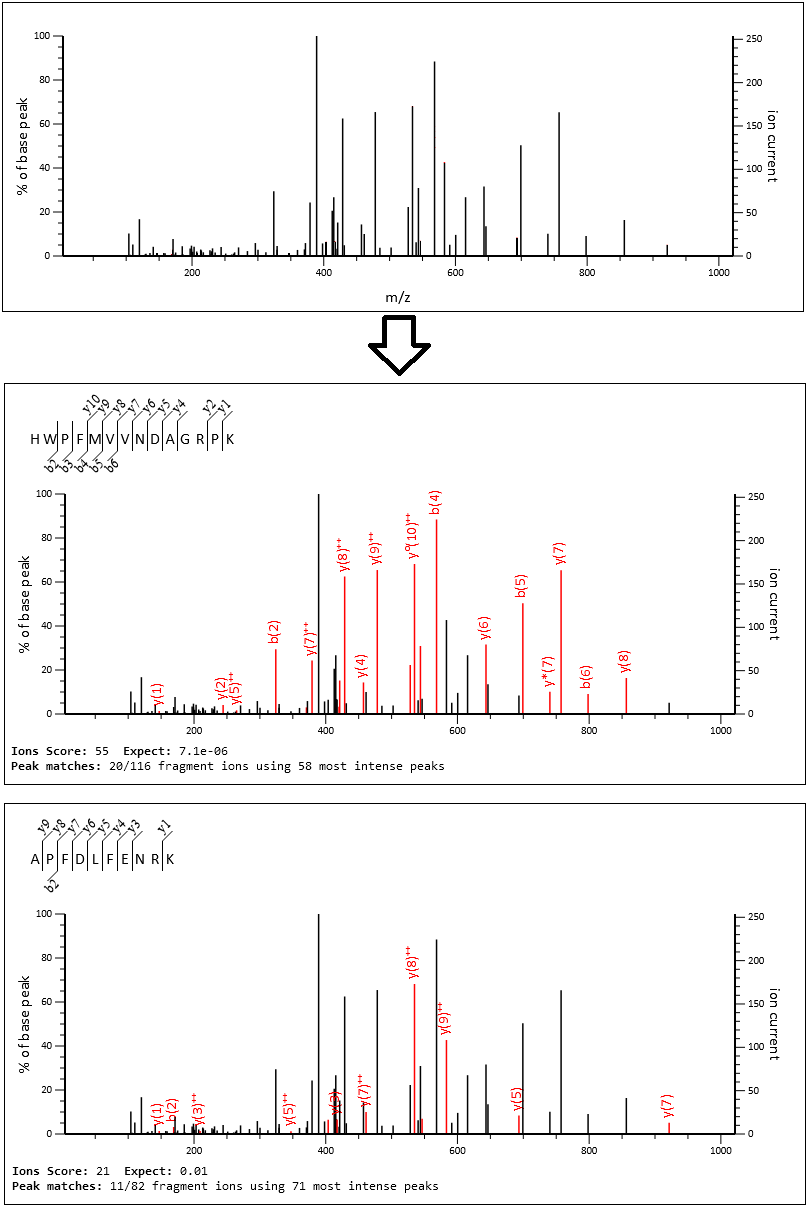
Mascot identifies fragment peaks for HWPFMVVNDAGRPK (found in heat shock cognates P11142 and E9PK54) and APFDLFENRK (found in heat shock protein HSP 90-alpha P07900), both with very good residue coverage. Apart from the y(1), y(8)++ and y0(10)++ peaks, there are no shared masses and almost all of the tall peaks are explained, so this spectrum is unlikely to contain more than two peptides. The cluster of peaks around 414Da are unfragmented precursor peaks. The very tall peak at around 390Da is an unexplained noise peak, as it’s outside the precursor isolation window.
The score and expect value are also shown in the screenshot. The score is -10log10(p-value), and the key point here is that it measures how unlikely the match is between the theoretical masses and the observed spectrum. Very low p-value (very high score) means the match is very unlikely to be random.
The new DIA scoring is able to go deeper into the peak list and select lower-intensity peaks. In the case of APFDLFENRK, Mascot was able to ignore all the tall peaks from the other peptide as ‘noise’ that is irrelevant to APFDLFENRK.
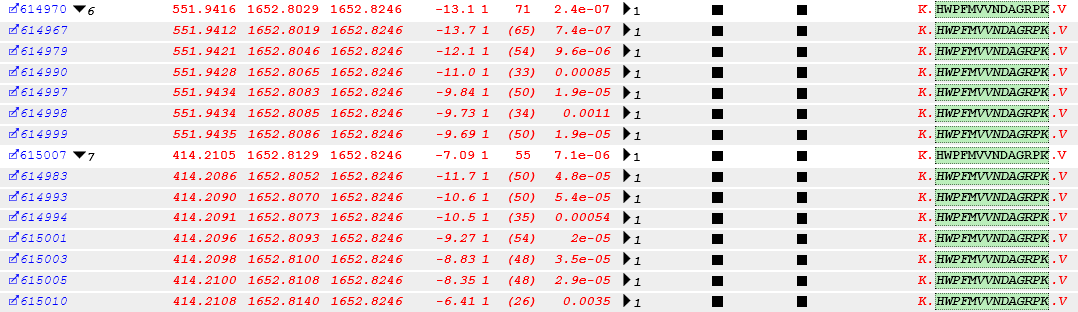
By the way, HWPFMVVNDAGRPK was identified in several sequential scan cycles in two different charge states; the PSM listing is shown below.