2D-TPP as easy as 1-2-3
Two-Dimensional Thermal Proteome Profiling (2DTPP) is a technique that profiles the thermal stability of a proteome as a function of ligand concentration as a way to detect ligand interaction. If the thermal stability changes with ligand concentration, there is an interaction between the ligand and that protein. The ligand can be a drug, metabolite or other small molecules. The analysis can also detect off target interactions of proteins which were not expected to have an interaction with the ligand.
The TPP methods were developed and extended at the European Molecular Biology Laboratory (EMBL) and Cellzome Gmbh by combing the principles of the cellular thermal shift assay with multiplexed protein quantitation using reporter ions like TMT. The initial publications used Mascot Server as the proteomics search engine, but more recent implementations do not accept Mascot Server search results directly. We have recently been working with a customer to fill that gap and format Mascot search results ready for analysis with current 2DTPP software.
2D-TPP analysis software
The original TPP paper used a software combination of isobarQuant for the isobaric reporter ion quantitation, an R statistics library called TPP and Mascot Server to analyze the data. The isobarQuant software package is still available but won’t run on the current version of python without modification.
The TPP R library has been expanded to support 2-dimension data, TPP2D, and is now part of the Bioconductor suite of bioinformatic tools. isobarQuant is technically obsolete as it appears to be no longer supported and, since Mascot Server can quantitate TMT reporter ions directly, it is no longer required anyway.
You can use a TPP2D and R directly on the command line to analyze the data. If you are not so familiar with working on the command line, another approach is to use ProSAP, an application with a graphics user interface that wraps the TPP2D library.
Experiment design
On the experiment design side, you can use the TMT labels multiplexing one concentration series and two temperatures per multiplexed sample or a complete temperature series for a concentration. The differences in experiential design are shown in the following tables:
| Multiple temperatures (Becher) | Single condition | |
|---|---|---|
| Channels encode | concentration series (+ 2 temps) | temperature series |
| Runs encode | temperature | concentration |
| Channels used / run | 8 of 10 (128C, 131N empty) | 10 of 10 |
| Runs to cover the design | 5 (× 1 replicate) | 4 (× 2 replicates) |
| Temperatures | 37.0–66.3 over 10 temperatures | 10 temperatures |
| Concentrations | 0, 0.05, 0.4, 3.2 - 4 conditions | 4 conditions |
| Reference channels / run | 2 (126 + 129N) | 1 (126) |
| Channel | Temp °C | Concentration | Reference |
|---|---|---|---|
| 126 | 37.0 | 0 | ← ref |
| 127N | 37.0 | 0.05 | |
| 127C | 37.0 | 0.4 | |
| 128N | 37.0 | 3.2 | |
| 128C | — | unused | |
| 129N | 40.4 | 0 | ← ref |
| 129C | 40.4 | 0.05 | |
| 130N | 40.4 | 0.4 | |
| 130C | 40.4 | 3.2 | |
| 131N | — | unused |
Data analysis
Once the experiment has been run and the data acquired, it’s just the case of searching the it in batches with Mascot Daemon like a normal dataset using a TMT quantitation method. As the peak list contains the reporter ion intensities, Mascot Server can calculate the peptide and protein quantitation values directly. You can either use Mascot Daemon’s quantitation summary to export the quantitation results to a CSV file or have a script extract the quantitation results from the Mascot Server search results.
For a traditional 2 temperatures per multiplexed sample, you will need to make a sample table that encodes the experiment design and labeling strategy – this is a simple comma separated value text file. For a one condition per a multiplexed sample this is not required. There are also some additional config files in the JSON text format too. A script then uses the config files and takes the exported Mascot results converting the data into a “long format” CSV file. A long format file structures data so that each row represents a single observation, resulting in more rows and fewer columns. At the same time, the data are normalized to the control channel, typically 37°C and no ligand, ready for use in ProSAP or with the TPP2D library without any further data wrangling needed.
We have released the scripts needed to prepare the data for analysis. Instructions on their use and example data available in our public GitHub repository. The repository includes some additional scripts which visualize the ProSAP/TPP2D results, generating plots of the two extremes and the unchanging “housekeeping” proteins.
Example results
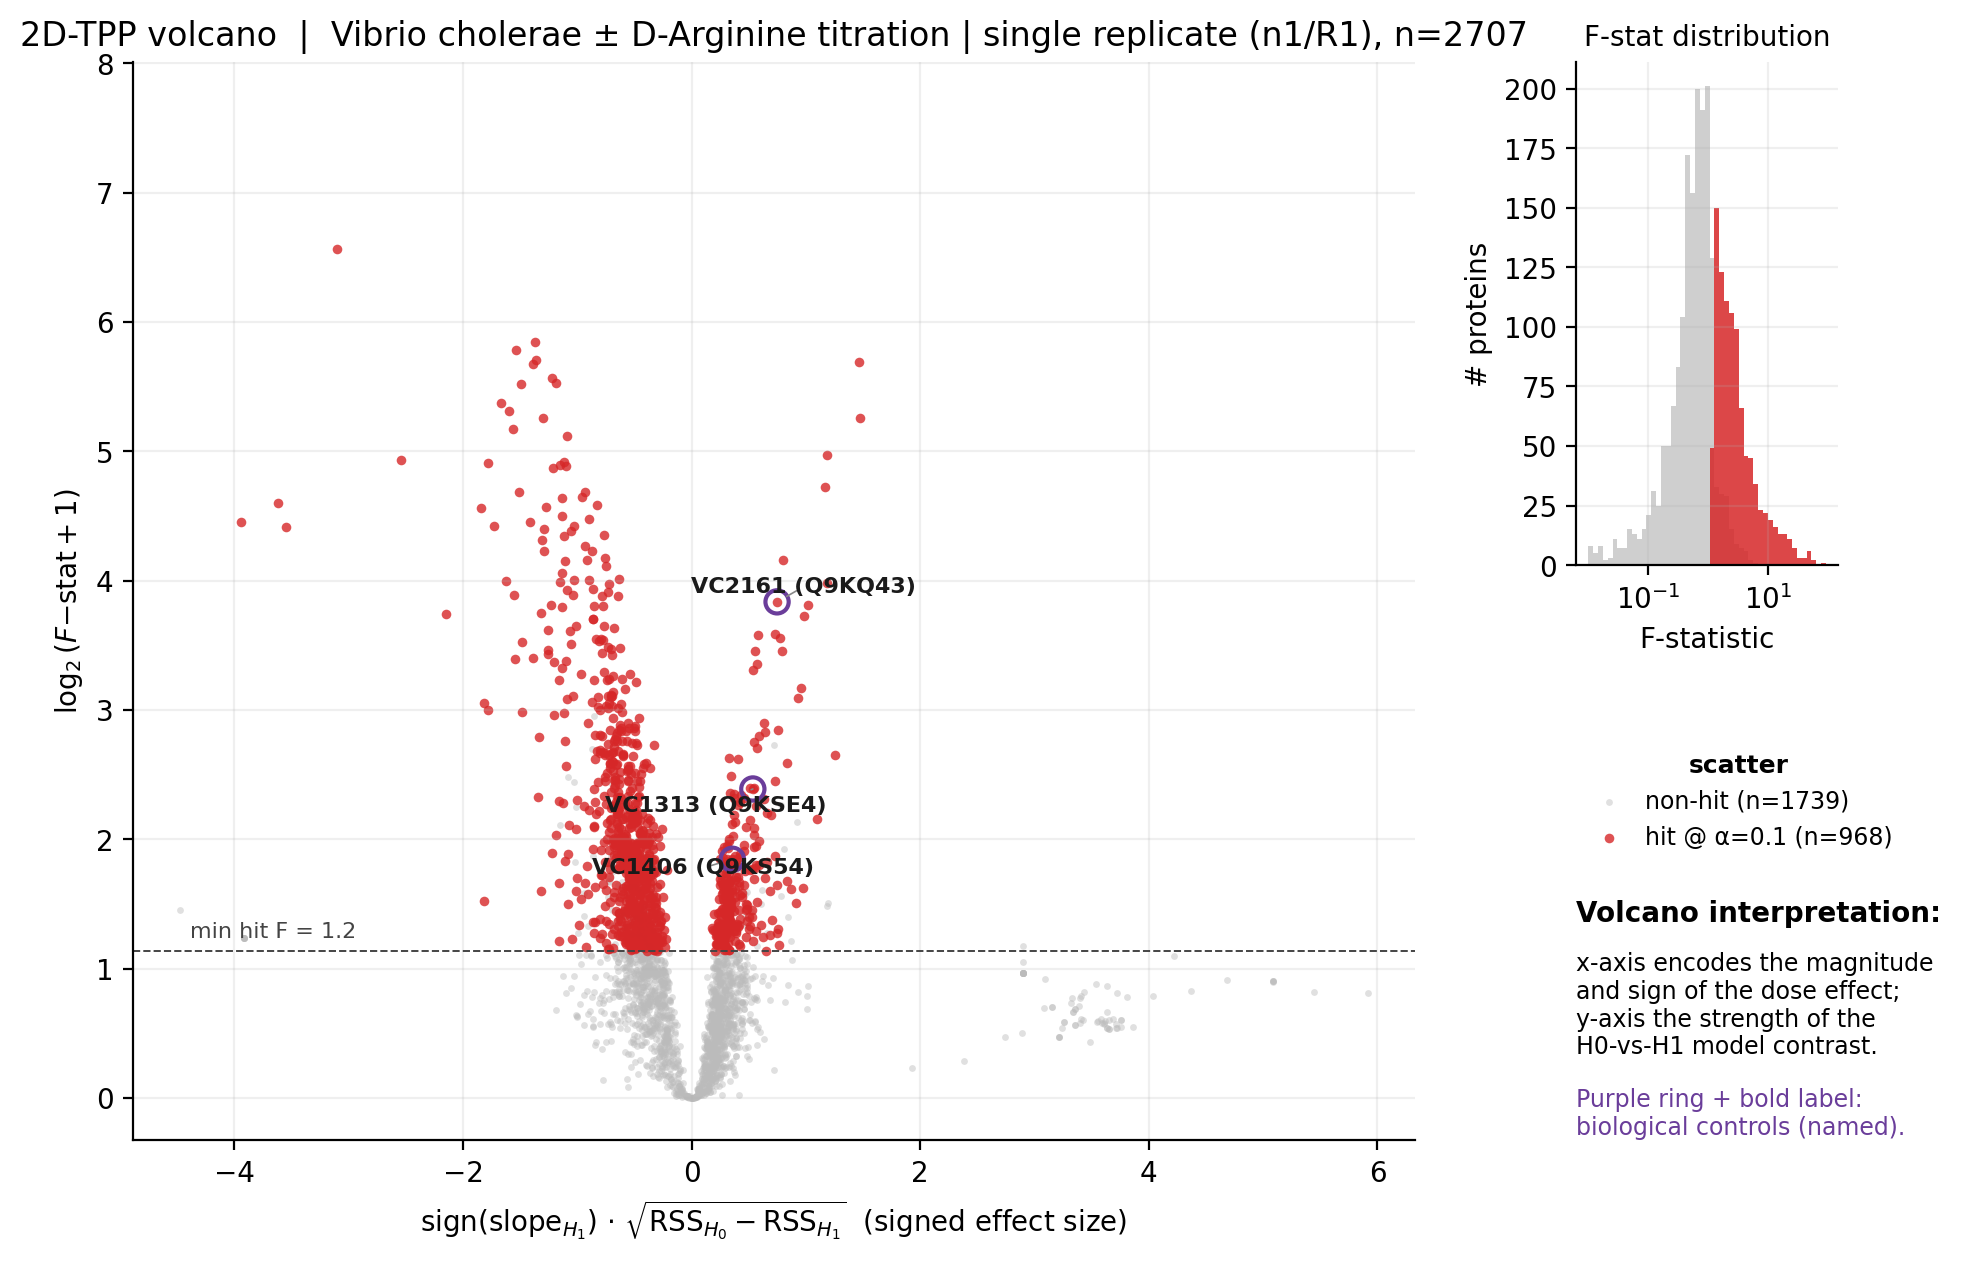
To develop and test the conversion scripts, I used the dataset from the PRIDE project PXD038312 (Mateus et al., Nature Microbiology 2023), a 2D-TPP screen for the Vibrio cholerae chemoreceptor that senses D-arginine. The experiment compared four D-arginine concentrations (0, 0.05, 0.4, 3.2 mM) and ten temperatures (37.0–66.3 °C) using TMT10plex labeling. The authors identified three chemoreceptors VC1313 (the receptor itself, MCP_DRK), VC2161 (Mlp24) and VC1406 from the 2D TPP analysis.
ProSAP can be downloaded and installed but requires a specific version of R and various R libraries to work correctly. It is easy to end up in a situation where one R application requires the latest version of R and another an older version. There is a feature in R that works around this, rig, but that is not always compatible with Windows computers that require admin access to install programs.
Another workaround is to use a R-portable installation which is what I have done here. Run the Setup-CustomR command to install R and the compatible versions of the required libraries.
Data were searched using multiple Mascot Daemon tasks, merging the fractions into a single search. Search parameters were taken from the publication.
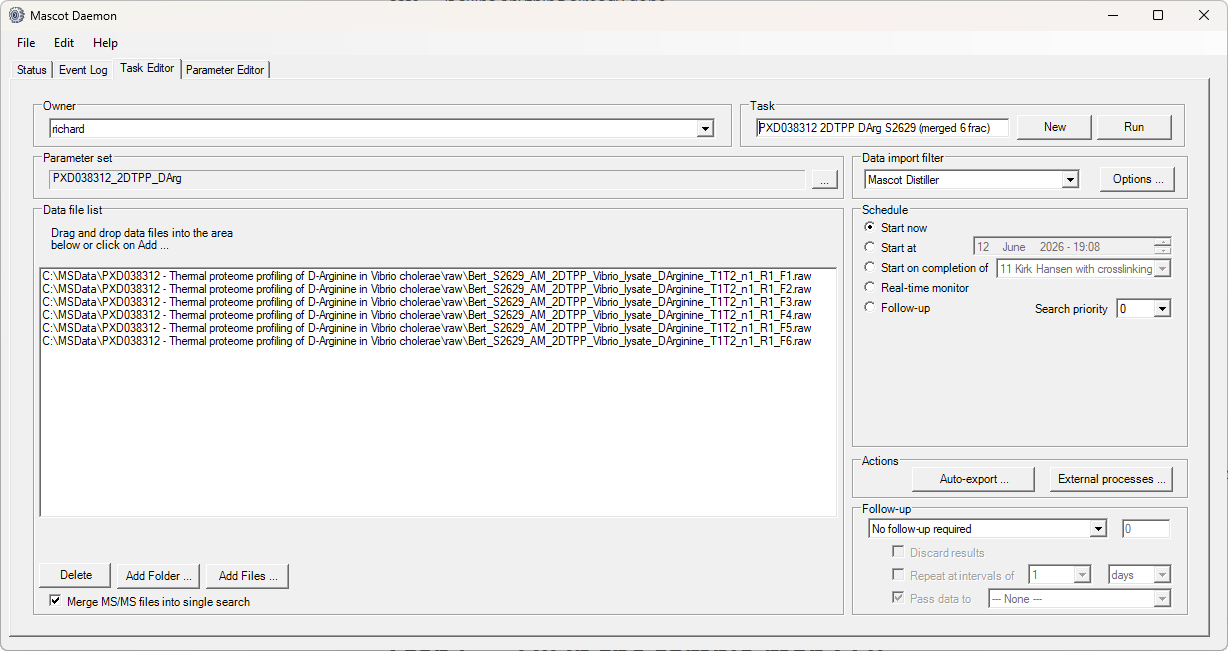
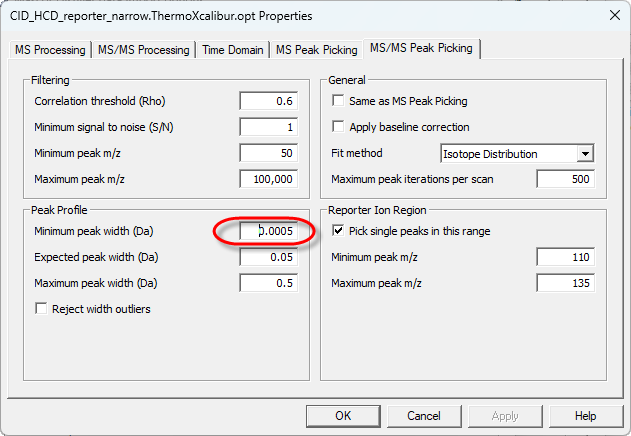
I used Mascot Distiller for the peak picking and had to adjust the peak picking options lowering the MS/MS Minimum peak width (Da) parameter to 0.0005 so that it would correctly capture the narrow reporter ions.
We created a sample table that maps the samples and channels to the concentrations and temperatures; it is included in the repo. Once all the task completed, the results can either be exported as a quantitation summary from Daemon, or the result URL passed to the script mascot_to_tpp2d_input.py. The quantitation summaries for the tasks are included in the example-data directory. To make the proSAP/TPP2D input file run the daemon_to_tpp2d_2dplex.py script.
Load the long formatted CSV file in to proSAP and analyze the 2D TPP data.
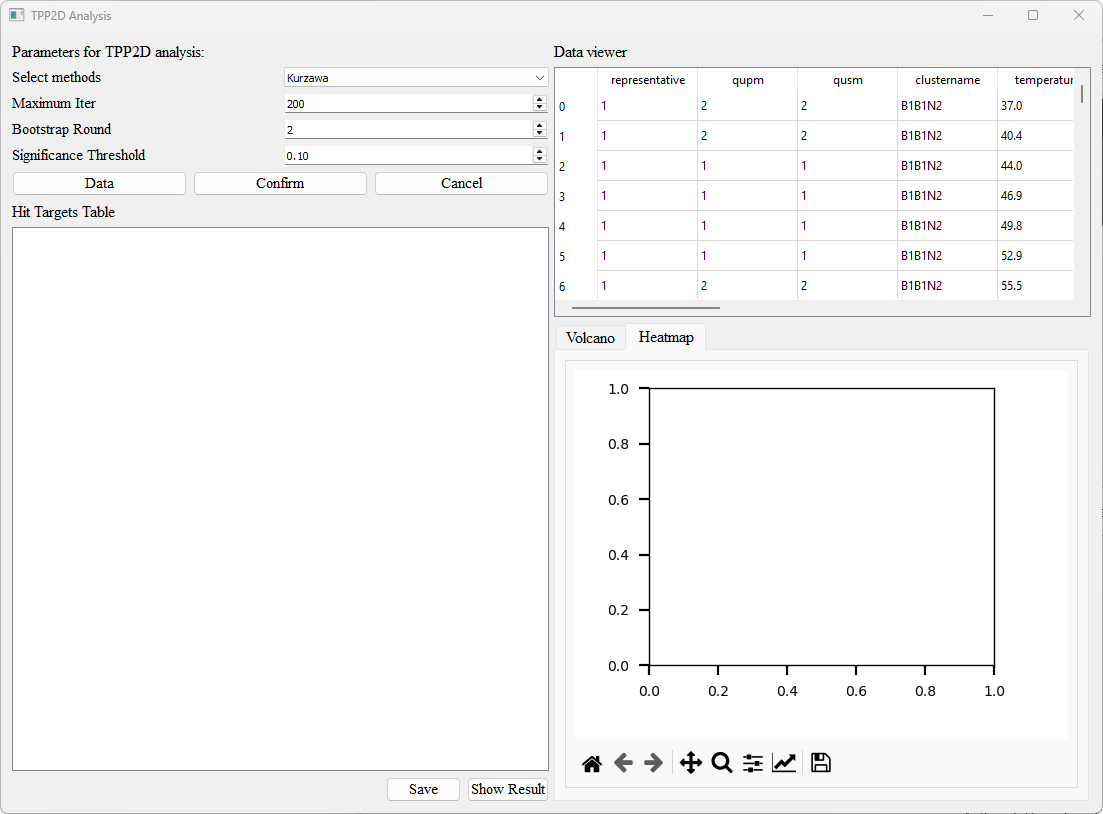
Save the results of the 2D-TPP analysis for interpretation.
The repo contains several visualization scripts to make it a bit easier to get a graphical overview of the results. The scripts are configurable and you can specify the proteins that are labelled and plot colors etc. The volcano plot shows a broad spread of dose-responsive proteins, with the published proteins of interest highlighted.
Melting plots for the three chemoreceptors identified in the original publication all display a dose-dependent thermal stabilization signature similar to that we expect:
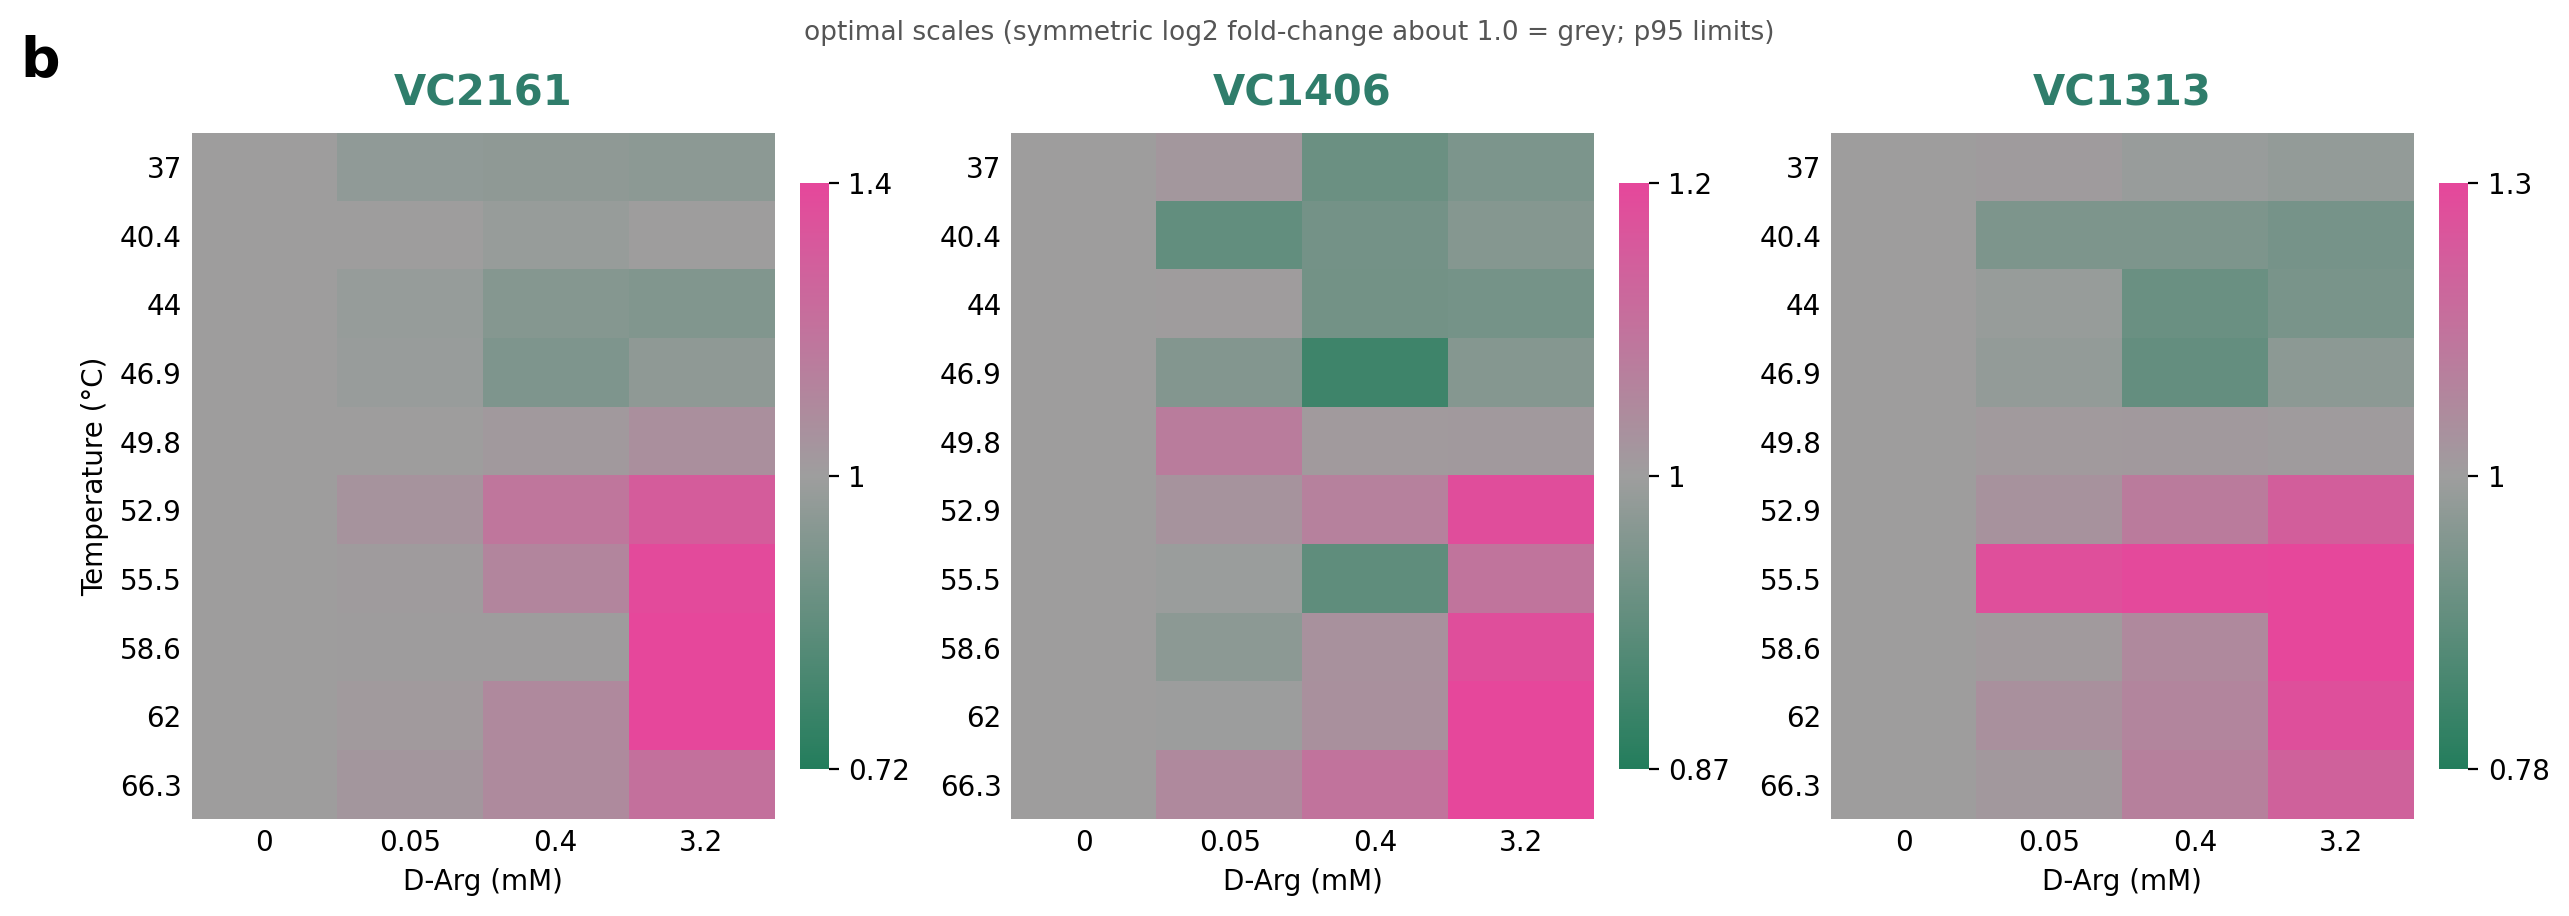
The exact results are very similar to the publication as you would expect.
Is there a particular workflow that you would like to use Mascot search results for? Let us know at support@matrixscience.com and we can help you out.
Keywords: quantitation, reports, statistics, TMT