MS3 reporter ion quantitation with Mascot Distiller
A common issue encountered when carrying out reporter ion quantitation methods, such as TMT and iTRAQ, is that of interfering ion signals in the reporter region. One commonly used strategy which can be taken to mitigate against this is to reisolate the most abundant ion in the MS/MS spectrum and refragment it. The resultant reporter ion signals in the MS3 signal are then almost exclusively from the target peptide [1, 2]. Once this has been done, in order to carry out the reporter ion quantitation using the peaks from the MS3 signal, the MS3 spectrum needs to be reintegrated with the peaks from the parent MS/MS spectrum prior to carrying out the search and quantitation.
To support this, in Mascot Distiller 2.6 we added new options on the ‘Time Domain’ section of the ‘Processing Options’ dialog. Under the ‘Group combination’ section, if we have the ‘No summing’ option selected, we can choose to move the reporter ion peak region from the MS3 scans into the MS/MS scans. This will move the reporter ion mass region in the MS3 scan into the MS/MS scan prior to peak detection, replacing any peaks from the MS/MS scan and leaving you with the ‘clean’ reporter ion peaks from the MS3 scan in the generated peaklist. As we will show later, for this type of experiment, you do not want to select the option to sum the entire MS3 scan into the MS/MS scan since this will not replace the reporter ion region with the values from the MS3 scan; instead it will sum the spectra together and you won’t gain the benefit of the cleaner reporter ions from the MS3. Apart from the reporter ion values, the MS3 scan contains very little additional useful information for the purposes of the Mascot search.
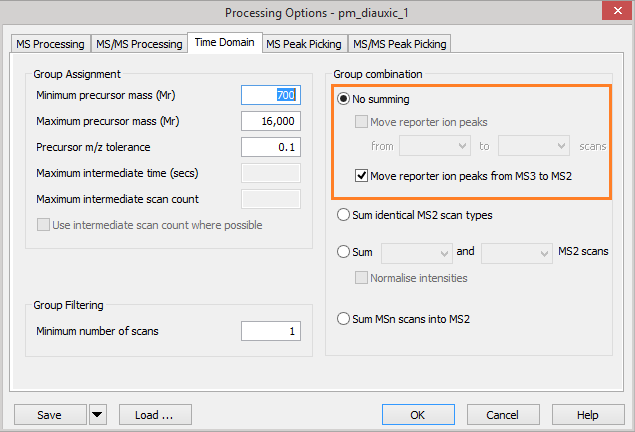 Figure 1: Mascot Distiller processing options for moving MS3 reporter ion peaks into the parent MS/MS scan
Once we’ve carried out peak detection using these options, on the peak lists tab in Mascot Distiller, we have our MS/MS and MS3 scans grouped together under the ‘Grouped Scans’ node. Figure 2 shows and example of this:
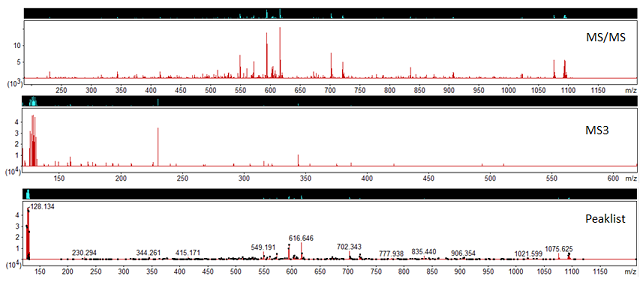 Figure 2: MS/MS, MS3 scans and the processed peaklist
In the example, the MS/MS scan does not contain any reporter ion peaks, whilst the MS3 spectrum does. If you select the ‘Grouped Scans’ node in Mascot Distiller, we can see that the generated peaklist for this precursor includes the reporter ions from the MS3 scan merged into the MS/MS peaks. When searched in Mascot using the associated quantitation method, the peptide matches will now have the reporter ion quantitation results derived from the MS3 scan, with no post processing required to associate the peptide identification back to the reporter ions.
To demonstrate the negative effect of summing the MS3 and MS/MS scans together, we processed data taken from a TMT 6-plex dataset on the PRIDE repository (PXD005890). With this dataset, the authors had mixed in synthetic peptides, labelled using the TMT reagents in a 3:3:3:1:1:1 ratio against a background of cell lines labelled 1:1:1:1:1:1 [3]. We reprocessed the raw data using Mascot Distiller in three different ways:
- Moved only the reporter ion region from the MS3 scans to the MS/MS scans
- Summed the entire MS3 scan into the parent MS/MS scans
- Discarded the MS3 scan
| Moved | Summed | MS/MS only |
|---|---|---|
| 2.994 | 2.704 | 1.993 |
As you can see, the mean ratio using the MS3 reporter ions is very close to the target value of 3, whilst summing the MS/MS and MS3 spectra together does result in the ratio being slightly suppressed. The MS/MS only dataset displays a significant amount of ratio suppression.
If you are using data from a Thermo Orbitrap Fusion Lumos instrument for this type of experiment, there is a known issue which may require you to update the version of MSFileReader installed on your Mascot Distiller workstation. More details can be found on the Mascot Distiller support pages on our website.
References:
- Ting L, Rad R, Gygi SP, Haas W. Nature Methods. 2011 8(11):937-940
- McAlister GC, Nusinow DP, Jedrychowski MP, Wühr M, Huttlin EL, Erickson BK, Rad R, Haas W, Gygi SP. Analytical Chemistry 2014 86(14):7150-8
- Hughes CS, Spicer V, Krokhin OV, Morin GB. J Proteome Res. 2017 16(5):1839-1846
Keywords: iTRAQ, Mascot Distiller, MS3, quantitation, reporter, TMT