Chimeric spectra (DDA, WWA, DIA)
Introduction
Database search engines often assume that an MS/MS spectrum is derived from a single precursor. This greatly simplifies peptide identification, as any non-fragment peaks can be assumed to be random noise. However, there are many situations where a spectrum can contain fragments from multiple precursors, either by random chance or by design.
Chimericity by chance (DDA)
The most common shotgun proteomics technique is Data-Dependent Acquisition (DDA). In this mode, the mass spectrometer makes a survey of precursors, then selects the most intense ones for MS/MS fragmentation. Survey scans are followed by multiple MS/MS scans, for example: fragment the top 20 most intense precursors, yielding 20 MS/MS spectra.
Precursor ions are selected by mass within an isolation window, which is often 1.5 m/z or less. If the mass analyser contains any isobaric or near-isobaric peptides, they pass through the same isolation window and are fragmented together. The result is a chimeric MS/MS spectrum, containing fragments from multiple peptides.
Peptides are obviously more difficult to identify from chimeric spectra, because it is hard to tell a priori whether the interfering peaks are random noise or peptidic. If the coisolated peptides have very similar sequences, and thus share many fragments, it adds an extra level of ambiguity.
Separation techniques like fractionation and LC reduce the chance of chimeric spectra, but they never eliminate it completely. When the peptide has variable modifications, positional isomers may end up in the same MS/MS spectrum. Metaproteomic or environmental samples are more likely to have chimericity, simply because there is a higher chance of very similar peptide sequences arising from related species.
Chimericity by design (WWA, DIA)
Chimeric spectra are also created by design. Multiplex quantitation like IPTL is a good example: the light, medium and heavy peptides are isobaric, fragment together and produce MS/MS peaks a fixed distance apart.
When the DDA isolation window is increased to 3-4 m/z or more, it is sometimes called wide window acquisition (WWA). The spectrum typically contains fragments from an intense precursor and smaller peaks from the less intense, near-isobaric ions. Many other selection strategies are possible, such as coisolating precursors in a pair of windows around the selected mass.
A very different strategy is Data-Independent Acquisition (DIA). In this mode, the mass spectrometer simply fragments everything without intensity selection. The MS/MS scans are performed sequentially through a mass range, say 400 to 1200 m/z, using either fixed or variable isolation windows. Two broad categories are narrow window DIA, where the isolation window is typically 4-8 m/z, while wide window DIA uses larger windows from 8 m/z to 20 m/z or even 32 m/z. An early example is Sequential Window Acquisition of all THeoretical fragment ion spectra (SWATH MS). Variable windowing schemes can have a complicated structure of partially overlapping isolation windows whose width varies by mass; see Data-Independent Acquisition Mass Spectrometry-Based Proteomics and Software Tools: A Glimpse in 2020 for a comprehensive review.
Narrow window DIA MS/MS spectra are similar to WWA spectra. They typically contain fragments from a few precursors. Wide window DIA spectra, on the other hand, are highly convolved and may contain fragments from a few to dozens of precursors. DDA spectra tend to be dominated by one strong precursor, sometimes called the primary peptide, and one or a few secondary peptides. DIA spectra have no predictable relationship between the convolved precursor, as everything is selected for fragmentation.
Preparing chimeric spectra in Mascot Distiller
Mascot Distiller supports chimeric spectra since version 2.5.
- DDA, including WWA: All data formats are supported.
- Narrow window DIA: Distiller can process narrow window DIA data from Thermo instruments. Other instruments are not currently supported.
- Wide window DIA: Not currently supported.
Chimeric spectrum support is disabled by default. To enable it:
- On the MS/MS Processing tab of the Processing Options dialog, ensure that “Maximum number of precursor m/z values” is set to a value greater than 1. The maximum is 10.
- Under MS/MS Processing tab, Precursor selection, set “Search within m/z tolerance of” to a bit over half the isolation window. For example, if isolation window is 4 m/z, set the tolerance to 2.2 (to allow for instrument accuracy).
- On the Peak List Format tab of the general preferences dialog, ensure that the ‘Allow multiple precursors per scan’ checkbox is checked.
Then, process all scans to do peak picking. When you save the peak lists as MGF, or when you submit a search to Mascot Server, precursor masses are encoded as multiple PEPMASS lines, which triggers Mascot chimeric searching.
Matching chimeric spectra with Mascot Server
Chimeric spectrum support was added in Mascot Server 2.5. The feature is triggered by submitting peak lists in MGF format where the query has more than one PEPMASS line. If your instrument system or peak picking solution does not produce MGF in this format, we recommend Mascot Distiller.
Below is an example generated by Mascot Distiller:
BEGIN IONS
TITLE=23802: Scan 27055 (rt=2574.86) from file [0]
PEPMASS=757.41841 16213394 2+
PEPMASS=758.92768 2265990.4 2+
CHARGE=2+
SCANS[0]=27055
RAWSCANS[0]=sn27055
RTINSECONDS[0]=2574.8561
110.07078       209.9728
. . .
END IONS
When Mascot reads in a chimeric spectrum with multiple precursors (PEPMASS), it splits the query into subsidiary queries, one per precursor. Each subsidiary query has a copy of the original peak list, as well as a link to the ‘parent’ query. The link is the source index, which is simply a running index for the BEGIN IONS lines in the MGF file.
We also recommend including the scan number as a SCANS line. This simplifies downstream processing and ensures you can easily tie peptide-spectrum matches back to the original MS/MS scans. Mascot Distiller always includes the SCANS line.
During a database search, Mascot matches and scores peptides against subsidiary queries independently in exactly the same way as non-chimeric spectra. Any interfering fragments from a different peptide are treated as noise. In particular, the search engine does not try to subtract, mask or attenuate interfering fragment peaks. If the chimeric spectrum has two subsidiary queries, and the same peptide is within tolerance of both PEPMASS values, Mascot will try matching it to both subsidiary queries.
At the end of the search, the results report (Protein Family Summary, Select Summary, Peptide Summary) filters out “chimeric duplicates”. Two peptide matches are chimeric duplicates if they have the same precursor mass and match more than one subsidiary query of a chimeric spectrum. Only the candidate with the smallest mass error is kept.
Advantages
The approach Mascot takes is simple, but it has several advantages:
- Scaling: Chimeric spectrum searches are embarrassingly parallel.
- Comparability: Scoring is the same between chimeric and non-chimeric spectra.
- Confidence: Chimeric spectrum matches must have unambiguous MS/MS evidence in order to get a good Mascot score.
- Universality: The search engine makes no assumptions about the data acquisition strategy.
- Independence: The search engine does not need experimental or predicted spectral libraries, or any machine learning models.
Most Mascot functionality supports chimeric spectra with no changes.
Decoy databases: The automatic decoy search works normally. Whether decoys are generated from reversed or random protein sequences, they are matched to chimeric spectra in the same way as target peptides. We recommend using reversed peptide sequences with chimeric spectra: set DecoyTypeSpecific 2 in your Mascot options.
Percolator rescoring: Although the search engine is deliberately independent of machine learning models, we recommend using automatic decoy searching and enabling Percolator rescoring after the database search. This often boosts peptide matches with middling spectral evidence whose non-spectral features are consistent with correct matches.
Quantitation: MS1 quantitation protocols Precursor, Replicate and Average work normally. Reporter quantitation (iTRAQ, TMT) is unlikely to work, because reporter peaks from multiple precursors will be summed together. Multiplex quantitation (MS2-based like IPTL or SILAC) may work but is likely to suffer from too much interference.
Error tolerant searching: Identifying unsuspected modifications and cleavage using error tolerant searching works normally.
Spectral libraries: Because chimeric spectra are split into subsidiary queries, you can use spectral library searching in the usual way.
Exporting results: All export formats are supported. In the XML format, the source index is <peptide> element attribute ‘index’; in CSV format, pep_index column. In mzIdentML and mzTab, the spectrum identifier is the source index. If the input MGF specified scan numbers (SCANS or RAWSCANS), these can also be used for grouping chimeric matches.
Limitations
There are, however, several important limitations in the current version.
Mascot scoring is tolerant to noise, but there is a limit to how many peptides are identifiable in a single spectrum. It is typically possible to identify a strong primary peptide, then a secondary peptide and sometimes a tertiary peptide. As you add fragments from more and more precursors, the score for the weaker peptides approaches zero. Even if the precursors all have approximately the same intensity and similar amount of fragment evidence, it is rarely possible to detect more than 5 peptides per spectrum.
The scoring behaviour means Mascot is a very good choice for DDA, WWA and narrow window DIA, where spectral complexity is limited. The current version is overly conservative with wide window DIA where the isolation window is 8 m/z or wider.
Getting ‘good’ decoy matches with chimeric spectra becomes harder the more inherently complex the spectrum. In particular, the rate of random matching among target sequences might no longer equal the rate among decoy sequences. In the limit, as the number of successful decoy matches decreases towards zero, the false discovery rate is underestimated.
We recommend using reversed peptides (digest, then reverse) rather than reversed proteins (reverse, then digest) with chimeric spectra. Reversed protein sequences tend to produce shorter tryptic peptides, and short sequences rarely get a good score against chimeric spectra.
Mascot bundles NIST MSPepSearch for spectral library searching. MSPepSearch scoring is similarly affected: getting a good library score becomes difficult beyond 2-3 precursors.
Another limitation is in the Protein Family Summary report and Peptide View. Mascot does not currently visualise the links between subsidiary queries, so they can be hard to discover and evaluate. Peptide View does not currently display an overlay of chimeric matches. It is best to export the results as mzTab, XML or mzIdentML and use custom scripting or a statistics package to investigate chimericity. For example, group PSMs by scan number.
Chimericity report
Because non-chimeric and chimeric spectra are matched and displayed in the same way, it is quite hard to get an overall view of the ‘chimericity’ of the data. The below Perl script provides a basic chimericity report.
chimericity_report.zip (4 kB)
Installation instructions:
- Make sure Perl is installed. On Linux, Perl is typically part of the operating system. On Windows, we recommend Strawberry Perl.
- Install the Perl module XML::Twig. On Linux, this may be available from the distribution repository (e.g. apt install libxml-twig-perl). Or, install with cpan XML::Twig.
- Download and extract chimericity_report.zip.
The script reads search results in Mascot XML format. Go to the Mascot results report and choose to export the results as XML. Select the following options in the export form:
- Set desired target FDR and enable/disable Percolator.
- Accept the defaults under Search Information.
- Accept the defaults under Protein Hit Information.
- Accept the defaults Peptide Match Information.
- Enable Query Level Information and tick “Query title, retention time*, scan number*”.
- Export
Save the XML file. Assuming it’s called F007503.xml, you can now get a chimericity report with:
perl chimericity_report.pl F007503.xml
The script summarises the chimericity of the peak lists (how many PEPMASS lines per spectrum) and the chimericity of the search results (how many significant matches per spectrum). Example output is shown below.
Example data set
This example is a publicly available data set from the PeptideAtlas repository, PASS00665 (Shteynberg et al., JASMS 26(11): 1837-1847). The four files are technical replicates of an unfractionated yeast whole cell digest. Spectra were acquired in DDA mode using 3 m/z isolation window (aka WWA), with 20 MS/MS scans after each survey scan.
We processed 120913-Yeast-02.raw with Mascot Distiller, allowing for up to 4 precursors per MS/MS spectrum. The best settings for this data set were prof_prof.ThermoXcalibur.opt, set precursor tolerance to 1.8 m/z and set S/N threshold to 0.1.
The peak lists were exported in MGF format, then searched using Mascot against the S. cerevisiae sequences in the SwissProt database. Automatic decoy searching was on, and the Mascot option set to DecoyTypeSpecific 3 to use random decoy sequences. The significance threshold was adjusted to give 1% PSM FDR.
The search has 80,784 MS/MS spectra (see below), with an average of a bit less than two precursors per spectrum, yielding 148,781 queries. Mascot identified 47,655 PSMs at 1% PSM FDR. If you enable Percolator rescoring, this increases to 56,986 PSMs. Protein FDR is quite high in both cases, but can be easily fixed by setting 1% sequence FDR, which also reduces PSM FDR to an excellent 0.3%.
Download and run chimericity_report.pl as described above. The chimericity report’s peak list section shows that Distiller was able to detect many additional precursors:
---Peak list chimericity report:

Number of Mascot queries, 148781
Number of MS/MS scans, 80784

Precursor masses per scan, Count
1, 33377
2, 30220
3, 13896
4, 3291
Just under half of the scans are chimeric, and 4.1% of scans have 4 precursors. The chimericity report for the database search shows how many actually got a significant match:
---Database search chimericity report:

Number of significant PSMs, 47622
Number of unassigned/unmatched queries, 101159

Number of scans with at least one significant match, 44394
Number of unassigned/unmatched scans, 36390

Scans with 1 precursor mass (non-chimeric):

Significant matches per scan, Count
0, 16659
1, 16718

Scans with 2 precursor masses

Significant matches per scan, Count
0, 12988
1, 15384
2, 1848

Scans with 3 precursor masses

Significant matches per scan, Count
0, 5478
1, 7356
2, 1041
3, 21

Scans with 4 precursor masses

Significant matches per scan, Count
0, 1265
1, 1734
2, 287
3, 5
4, 0
(The small difference in number of significant PSMs, 47,622 in chimericity_report.pl versus 47,655 in Protein Family Summary, is due to a rounding difference in expect values exported in XML format.)
In the search results, Mascot could, in many cases, identify a secondary peptide and sometimes a tertiary peptide. There are 3291 spectra with four precursors, and Mascot identified at least one peptide in 64% of them (2106 spectra). However, Mascot was unable to find four significant peptide matches in any of the quadruply chimeric spectra, which illustrates the limitation in the current Mascot scoring.
There are many chimeric spectra with excellent fragmentation from both the primary and secondary peptide. Query 132717 and query 86393 are both from scan 77940.
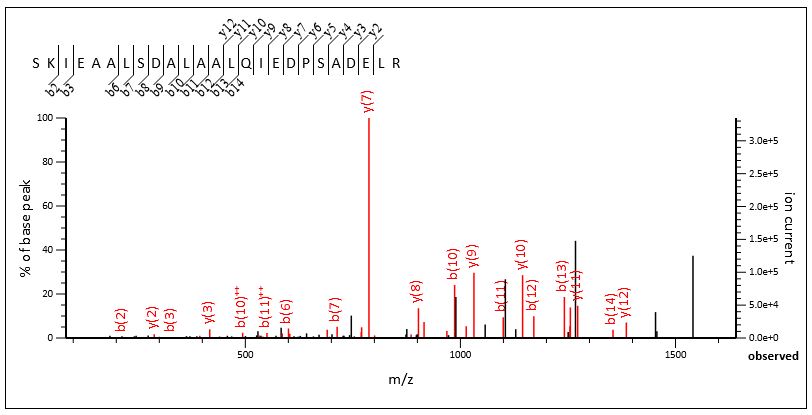
Query 132717, scan 77940, SKIEAALSDALAALQIEDPSADELR 3+, Mascot score 83
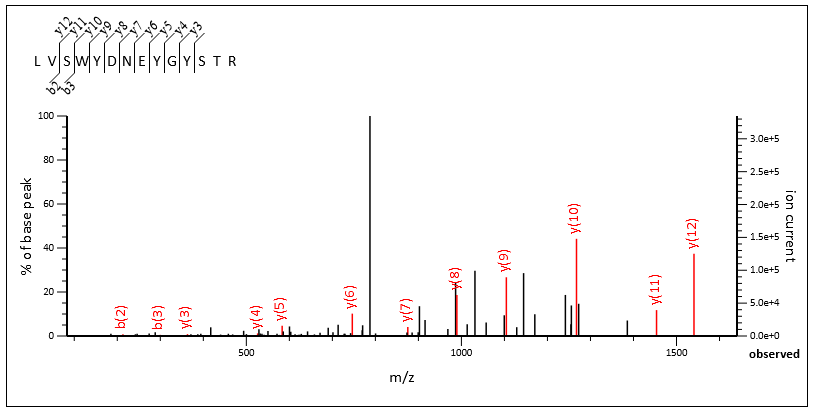
Query 86393, scan 77940, LVSWYDNEYGYSTR 2+, Mascot score 35
The chimericity of the spectrum is obvious when the two matches are viewed side by side, and Mascot confidently identified both.
