Optimizing peak picking with Mascot Distiller for any instrument
Introduction
Mascot Distiller has been designed to work with raw data from any instrument. The data file could contain a single, low resolution MS scan or it could be a complex, high resolution, DDA run from a hybrid instrument. Since nothing can be assumed about the raw data, Distiller has a very large number of parameters in its processing (peak-picking) options.
Although this makes for a steep learning curve, the peak picking has been designed to handle normal file to file variations without any ‘tweaking’. So, having arrived at suitable settings for a particular acquisition method on a particular instrument, you can save them to a file and choose this file as required. The settings that are used most often can be assigned as the default for that instrument type in Distiller Workstation.
If you are new to Distiller, you are welcome to send us a typical raw file and ask us to return a suitable processing options file. Just email support@matrixscience.com for details. This will give you a good starting point, but you will eventually want to gain a full understanding of the settings, because they are not just a function of the raw data, they are also a function of what you want to get out of the data. For example, the same file might be processed differently for identification compared with identification plus quantitation.
While it is unlikely that you will know nothing about the raw files you are working with, we’ll take this approach to illustrate the considerations behind each of the settings.
Create a new project
Normally, you would select suitable processing options at the same time as selecting the raw file(s). Whether you start from File menu; New project or File menu; New multi-file project, the file selection dialog has a drop down list of the processing options associated with the selected raw file format. If the file you want is not listed, or if you change your mind, you can load a new set of options at any time by choosing Processing menu; Processing options; Load…. Note that loading new processing options or saving changed processing options requires any peak lists to be deleted.
Create a new, single file project by choosing New project from the File menu, then the format of your raw data. The screen shots in this tutorial use a data file from a Thermo Orbitrap Velos Pro. If your file contains only MS data or only MS/MS data, some of what follows won’t apply.
On the Acquisition tab of dataset explorer, expand the TIC node so that all of the scans are displayed as a tree. Click somewhere near the middle of the TIC trace to get a sense of the data structure. Is it DDA, where each survey scan is followed by a number of MS/MS scans, or something more complicated? Invoke the processing options dialog by choosing Processing options from the Processing menu. You should now be looking at something similar to this:
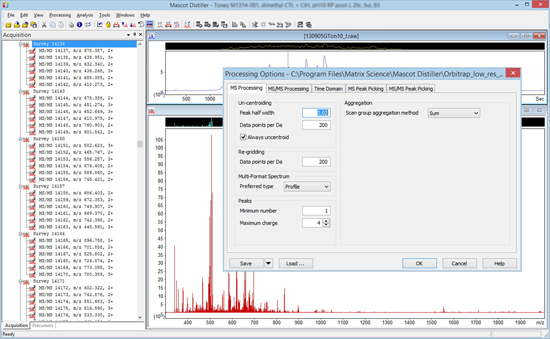
MS Processing tab
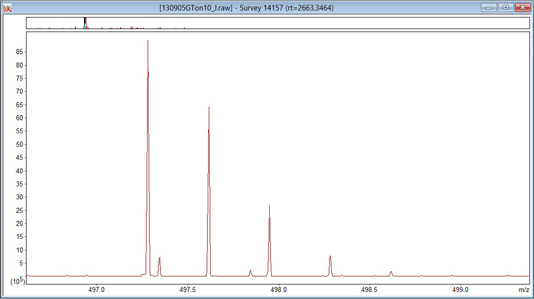
It is essential to know whether the raw data are profile or centroids. The way to find out is to set Preferred type to Centroided and uncheck Always uncentroid. Click on OK and then click on any survey scan to re-display it with the new settings. If the spectrum is a continuous trace, as in the first screen shot, below, it is profile data and peak picking is always required. If the spectrum consists of isolated, vertical lines, as in the second, it is centroid data and peak picking is optional.
With hybrid instruments, it is quite common for the MS scans to be profile and the MS/MS scans to be centroids. Occasionally, the raw file contains both formats. Leave Always uncentroid unchecked and swap Preferred type between Centroided and Profile. Remember that you have to click on the scan after any change to re-display it with the new settings. If you see the display swap between profile and centroid, then the raw file contains both.
Distiller peak picking requires profile data. If the raw data are centroids, and you want to create a de-isotoped peak list, it is possible to convert it back into profile data by ‘un-centroiding’. This comes at the cost of some increase in processing time, and there is an unavoidable loss of information if data have been badly centroided.
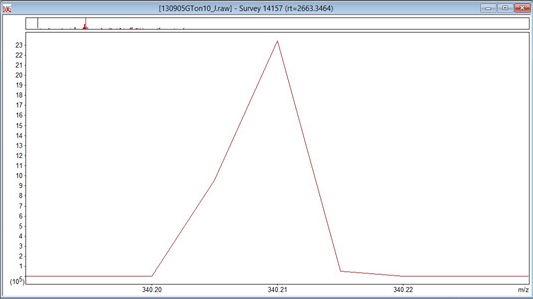
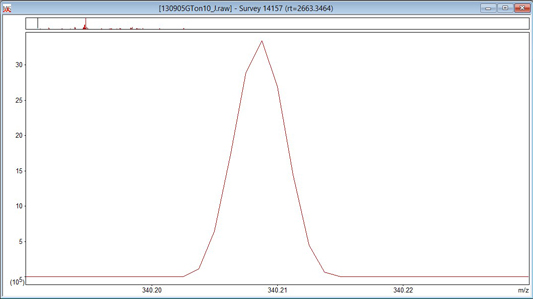
In the file being used to illustrate this tutorial, the MS scans are profile, so the settings in the Un-centroiding frame of the MS Processing tab can be ignored. Re-gridding is when profile data is mapped onto a new set of m/z values. This is necessary when the original data points are unevenly spaced or when scans with data points at non-identical m/z values are to be summed. Increasing the value of re-gridding will make processing take longer, so it should be set high enough to preserve the shape of the narrowest peaks, but no higher. Peak width may be constant across a scan, or it may vary. If it varies, the narrowest peaks are usually at the low mass end. Take a look at some intense, low mass peaks and see what happens as you change the value of re-gridding. If there is no change, then the data points are evenly spaced and the setting probably doesn’t matter. In the case of the Orbitrap data, the peak shape at 200 points/Da looks like the first screen shot, below. This is clearly distorted, and setting it to 800 points/Da gives the better approximation to a Gaussian shown in the second image.
Unless the raw file contains both profile and centroid data for each scan, the setting of Multi-format spectrum can be ignored.
For DDA-type data, we are interested in the precursor peak for an MS/MS spectrum even if it is the only peak in the survey scan. So, the setting for Minimum number in the Peaks frame is 1. The setting for Maximum charge is best determined by trial and error, as described in the MS Peak picking section.
Scan group aggregation method doesn’t apply to DDA-type data. If this was a series of MS scans, from a MALDI-TOF instrument, then Sum would cause all scans to be summed prior to peak picking while None would peak pick every scan individually.
MS/MS Processing tab
As with the survey scans, it is essential to know whether the raw MS/MS scans are profile or centroids. When you test for this, make sure you switch back to the MS/MS Processing tab each time you close and re-open processing options. Its easy to forget, start making changes to the MS Processing tab, and wonder why the changes have no effect.
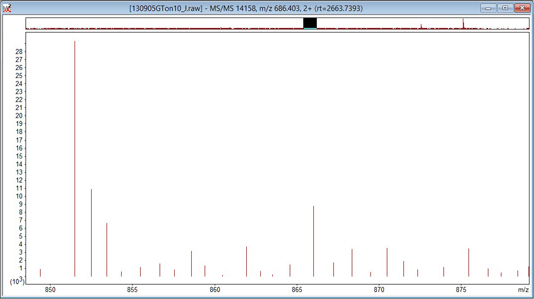
In the file being used to illustrate this tutorial, the MS/MS scans are centroids – peak picking has already been performed by the instrument data system. One option is to take the centroid values from the file, which minimises the processing time, using these settings:
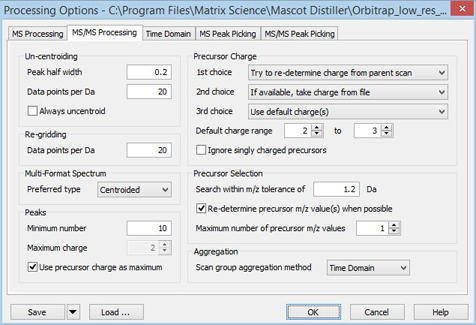
The settings in the Un-centroiding and Re-gridding frames can be ignored, apart from the Always uncentroid checkbox, which must be left clear. The setting of Preferred type only matters if the raw file also contains profile data for each MS/MS scan. In the Peaks frame, the Minimum number should be set to something reasonable, e.g. 10, since an MS/MS spectrum with only one or two peaks can never give a match, and is best discarded. Maximum charge and the associated checkbox only apply when Distiller is performing the peak picking, so can be ignored.
The controls in the Precursor charge frame enable the precursor charge to be assigned as reliably as possible. The screen shot shows typical settings. First choice is for Distiller to determine the charge from the survey scan. If this fails, then take the charge from the raw file. If there is no charge specified in the raw file, use defaults of 2+ and 3+. For an ionisation method that produces highly charged precursors, you might want to increase this range. Or, for MALDI ionisation, reduce it to 1+. If Ignore singly charged precursors is checked, spectra from singly charged precursors will be discarded. This is useful for electrospray analysis of tryptic peptides, where singly charged precursors are usually noise or non-peptide contaminants.
In the Precursor selection frame, if Re-determine precursor m/z value when possible is unchecked, Mascot Distiller will always use the precursor m/z value stored in the file. If checked, the value from the file will only be used if no peak is found in the survey scan within the range specified by Search within m/z tolerance. The most common problems with precursor m/z are that the instrument data system has called the charge incorrectly or it missed the 12C peak and picked one of the higher mass isotope peaks. Under such circumstances, the precursor mass can easily be out by 1 or 2 Da, so don’t confuse this tolerance with the expected mass accuracy of the instrument. If the peak list is intended for a search engine that supports multiple precursor masses, such as Mascot Server 2.5 or later, you can set Maximum number of precursor m/z values greater than 1. This allows for the possibility that the MS/MS spectrum contains fragments for more than one near-isobaric and co-eluting precursor.
For DDA-type data, Scan group aggregation Method should always be set to Time Domain, which means that precursor mass and charge information will be obtained from the ‘parent’ survey scan, and that MS/MS scans from a common precursor can be summed together according to the rules on the Time domain tab.
If you want Distiller to peak pick scans that are saved as centroids, in the Un-centroiding frame, check Always uncentroid. A Gaussian peak profile will be used to reconstruct the profile data, with the full width at half height in Daltons specified by Peak half width and a data point density of Data points per Da. The density should be at least 4 divided by the peak half width, to ensure that there are sufficient data points to define the peak shape accurately. Enter the same value into the Re-gridding frame.
When Distiller performs peak picking, it determines a charge for each fragment from the spacing of the isotope distribution. If your data has abundant high charge state precursors, there may be abundant fragments with charge states higher than 2+, yet Mascot Server only tries to match fragment peaks with charges of 1+ and 2+. One solution is to set Maximum charge to 2 in the Peaks frame, so that no time is wasted trying to determine the correct charge state for peaks that cannot be matched. The other possibility is to check Use precursor charge as maximum and also set fragment ions to be de-charged to MH+ in the Peak list format tab of Preferences. Don’t forget to do this because the default is to output fragments to the peak list as m/z values, which would mean that higher charge states would never be matched, even if the charge state had been determined correctly.
Time domain tab
The parameters on the Time domain tab control how MS/MS scans in DDA-type data are summed and filtered.
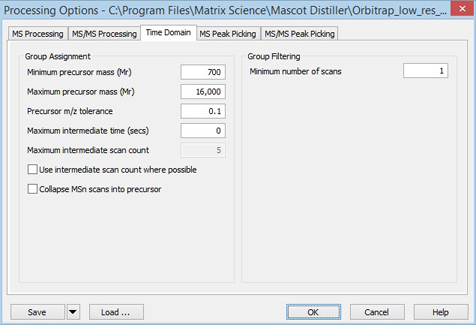
If your acquisition method used dynamic exclusion, so that there is only a single MS/MS scan for each precursor, you will want to disable summing by clearing Use intermediate scan count where possible and setting Maximum intermediate time (secs) to 0. On the other hand, if your acquisition method is to take 10 scans off each precursor to improve signal/noise, ensure that the settings of Precursor m/z tolerance, Maximum intermediate time (secs), and Maximum intermediate scan count will allow these scans to be summed without any risk of mixing them up with scans from other precursors. If you expect 10 scans off each precursor, you may also want to set Minimum number of scans to something larger than 1.
Peak picking
The controls on the MS and MS/MS peak picking tabs are almost identical. The reason for this duplication is that the characteristics of these two scan types may be very different. If they are similar in your data, you can simplify the settings by checking Same as MS Peak Picking on the MS/MS peak picking tab.
Note that, if you are taking centroids from the raw file for MS or MS/MS, the peak picking settings for that scan type are ignored.
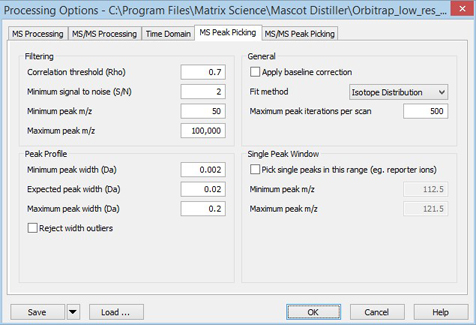
Distiller peak picking performs a least squares fit between a calculated isotope cluster and each candidate peak, returning the correlation coefficient for the optimum fit. Good fits to strong peaks will normally give correlation coefficients of 0.95 or better. Weak peaks will generally give lower correlation coefficients, and a cut-off of 0.7 for the Correlation threshold seems to work well in most cases. A value of 2 is a good starting point for Minimum Signal to Noise.
For true profile data, estimate the full width at half maximum of a peak in the middle of a scan, and use this to set Expected Peak Width in the Peak Profile frame. Set Minimum Peak Width a factor of 10 narrower and Maximum Peak Width a factor of 10 wider. If the scans are centroids that are being un-centroided, the Expected Peak Width is the Peak half width specified for un-centroiding, and the minimum and maximum can be set very close to this value, possibly a factor of 2 on either side.
If there is a definite offset of the baseline above zero, as is often the case for MALDI-TOF data, check Apply baseline correction in the General frame. Other settings can be as shown in this screen shot:
You can then refine these settings as follows:
- Choose a typical scan
- Right click in the spectrum window and choose Process this scan
- Sort the peak table by signal to noise ratio (S/N) and make a mental note of the S/N range of the 10 weakest peaks
- Sort the peak table by width
- There will probably be a few peaks that are on the upper and lower limits for the peak width. If these are very weak peaks, as measured by S/N, ignore them. But, if they are relatively strong peaks, this could indicate that either the upper or lower limit is badly set. Inspect the peaks to make sure they are being detected correctly, and that the reported widths are accurate. If so, adjust the limit and repeat.
- Sort the peak table by correlation coefficient (rho) to see whether there is any indication that the Correlation threshold is set too high.
- Sort the peak table by charge to see whether there are a lot of peaks with charge states on the upper limit. Don’t worry about a few peaks, especially if weak, but if there are many, strong peaks, this could indicate that the limit needs to be raised.
Once you are comfortable with these settings, process a typical scan and see whether any features, that look like real peaks, are being missed. If so, the cause could be Correlation threshold or Minimum Signal to Noise being too high, or Maximum peak iterations per scan being too low. Change these, one at a time, to identify the culprit. Remember that there will always be the occasional problem peak, and there needs to be a balance between detecting peaks and rejecting noise.
If you are using Distiller peak picking on both MS and MS/MS scans, the refinement procedure needs to be performed independently for both scan types.
Descriptions of other settings, not discussed here, can be found in the Distiller help, particularly under the topic Reference; Options dialogs; Processing options. Finally, once you have the settings just right for your data, don’t forget to save them!
