Automation of report creation for Mascot Distiller: MSstats report
In April’s blog post, we introduced the mascot-parser skill and developed an example QC plot. In this follow-up post, we introduce a Mascot Distiller skill and develop a new report that saves an MSstats formatted file from Distiller results.
Mascot Distiller has a range of reports that cover a lot of common use cases. It is not possible to include a report for every use case, so we included an extendable frame work to create custom reports with the Python programing language. We also published a tutorial on how to write your own report.
I used the documentation that ships with Mascot Parser, Mascot Distiller and the tutorial to develop an AI skill that can help write new Mascot Distiller reports or read Distiller results files directly for data extraction, further processing or reporting. The example skill can be downloaded from our GitHub repository and used with different LLM coding agents.
Once the skill is installed, you can use a LLM to interact with Mascot Distiller files. The skill also includes templates and instructions for creating new reports.
Mascot Distiller reporting
In the reporting tutorial, we give a step by step walkthrough to create a report. In this example, we use a LLM to develop a new MSstats report. MSstats is a well developed statistical framework designed for proteomics data. It handles group comparison, time-courses, paired samples, and more complex designs. It can also pool variance information across the dataset so that variance estimates are stable even with few biological replicates. It works with the output of many proteomics search engines.
MSstats report
The MSstats format is very simple and Distiller has all the information needed for the report. I fired up a LLM with the “/mascot-distiller” skill and put it to work. A transcript of the session is available. After a few iterations and some testing, I have a new report that produces CSV files ready for use with MSstats. I have made it available on our GitHub repository, so you don’t need to spend extra tokens to recreate it.
Paste the new report in “C:\Program Files\Matrix Science\Mascot Distiller\reports” and it will be available the next time Mascot Distiller starts. Once the report has been registered, you can edit/replace it without having to restart Distiller every time. It’s a standard Mascot Distiller custom report: open the quantitation project, go to Analysis → Reports → Custom → MSstats Format Export. Click through the wizard, and Distiller writes a CSV that drops straight into MSstats’ dataProcess workflow.
The output is the standard MSstats long format:
|
Column |
Value |
|
ProteinName |
Protein accession |
|
PeptideSequence |
Peptide with inline mods, e.g. IGS(Phospho)TENLK |
|
PrecursorCharge |
Precursor charge state |
|
FragmentIon / ProductCharge |
NA for DDA/precursor-level data |
|
IsotopeLabelType |
Label type (L for label-free) |
|
Condition |
Experimental group |
|
BioReplicate |
Replicate number, assigned per condition |
|
Run |
Raw file name |
|
Intensity |
Measured precursor intensity |
The report traverses the MS1 quantitation results by protein and peptide match recording the intensity for each raw file, reformatting peptide modifications and assigning biological replicate numbers per condition. We’ve tested it with label-free phospho experiments, a four-condition DIA study, and DIA-SILAC datasets producing half a million measurement rows.
MSstats example analysis
For testing purposes, I took a dataset that I had recently been working on for an ASMS poster: PRIDE PXD037506. It is a DIA data set profiling extracellular vesicles in urine with the goal of identifying novel biomarkers for prostate cancer diagnosis. I am testing a beta version of Mascot Distiller that supports DIA analysis, which will be released soon. I had processed a subset of the 40 participant data set using 5 case and 5 control samples. Using this analysis as a stating point I opened the Mascot Distiller multi-file project that had already been peak picked, searched and quantitated then exported the MSstats report.
I took the resulting csv file and processed it with MSstats going through a number of the example vignettes plus a few other sample appropriate reports. Before using the MSstats report, I had to change the Condition per-sample labels (10 conditions, 1 run each) remapped to two groups (Normal / Cancer). This information is recorded in Mascot Distiller but not yet programmatically accessible so can not be exported. This will be fixed in a future release. In the mean time, it’s an easy adjustment that can be done with a simple script prior to using the report.
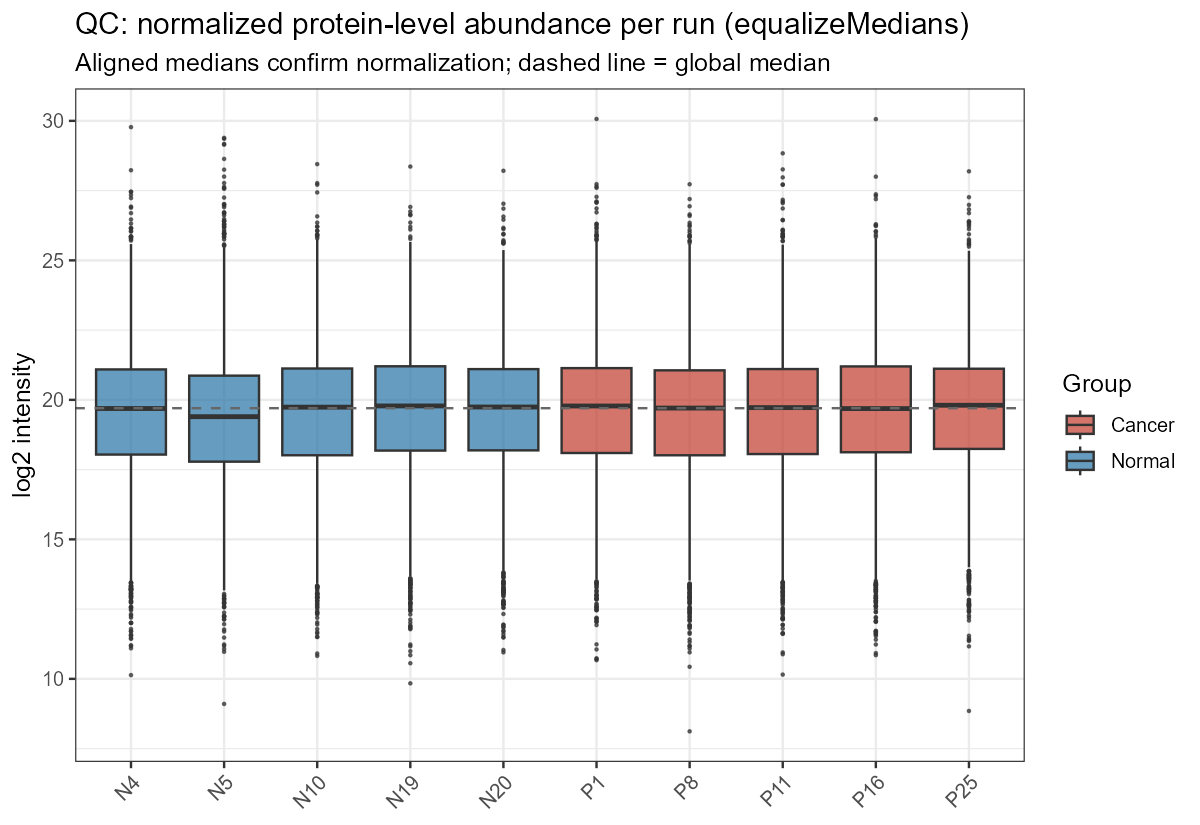
Here are some example MSstats plots. This quality control plot shows the normalized protein-level abundance per run after equalizeMedians normalization. It confirms that the normalization actually worked before you trust any cross-sample comparison. It means that any difference between conditions reflects biology, not a loading/depth artifact. Sample N5 is the outlier with poorer quality measurements but still within tolerance.
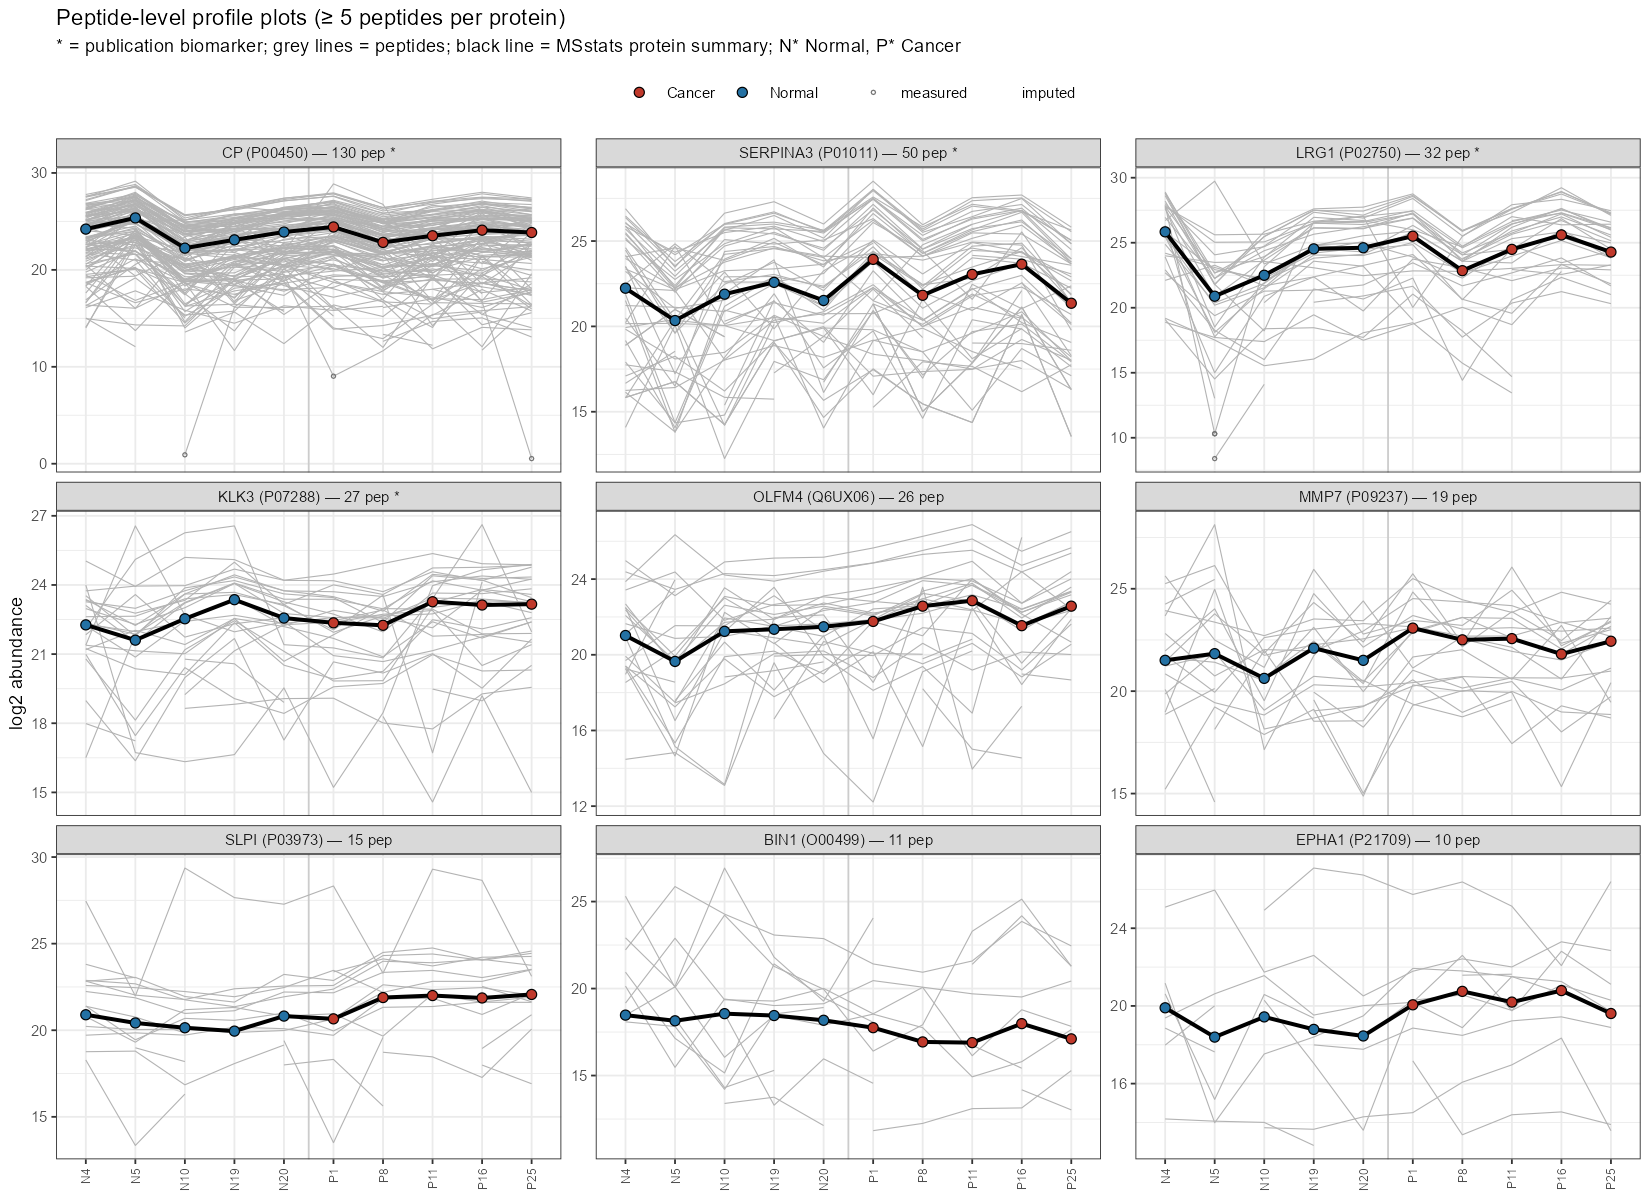
The peptide level profile plots show differences in proteins mentioned in the publication. Lots of peptide coverage, and the protein values sit in the middle of the peptide bundles and are not swayed by a few peptide outliers. SERPINA3 and LRG1 in particular start to show a visible separation/trend between the Normal and Cancer points, consistent with their biomarker status. The middle and third row show proteins with less coverage and more imputed values. They can visibily separate normal form cancer samples, but you need to look at the log2FC and adjusted p-values to see if the measurements are statistically significant.
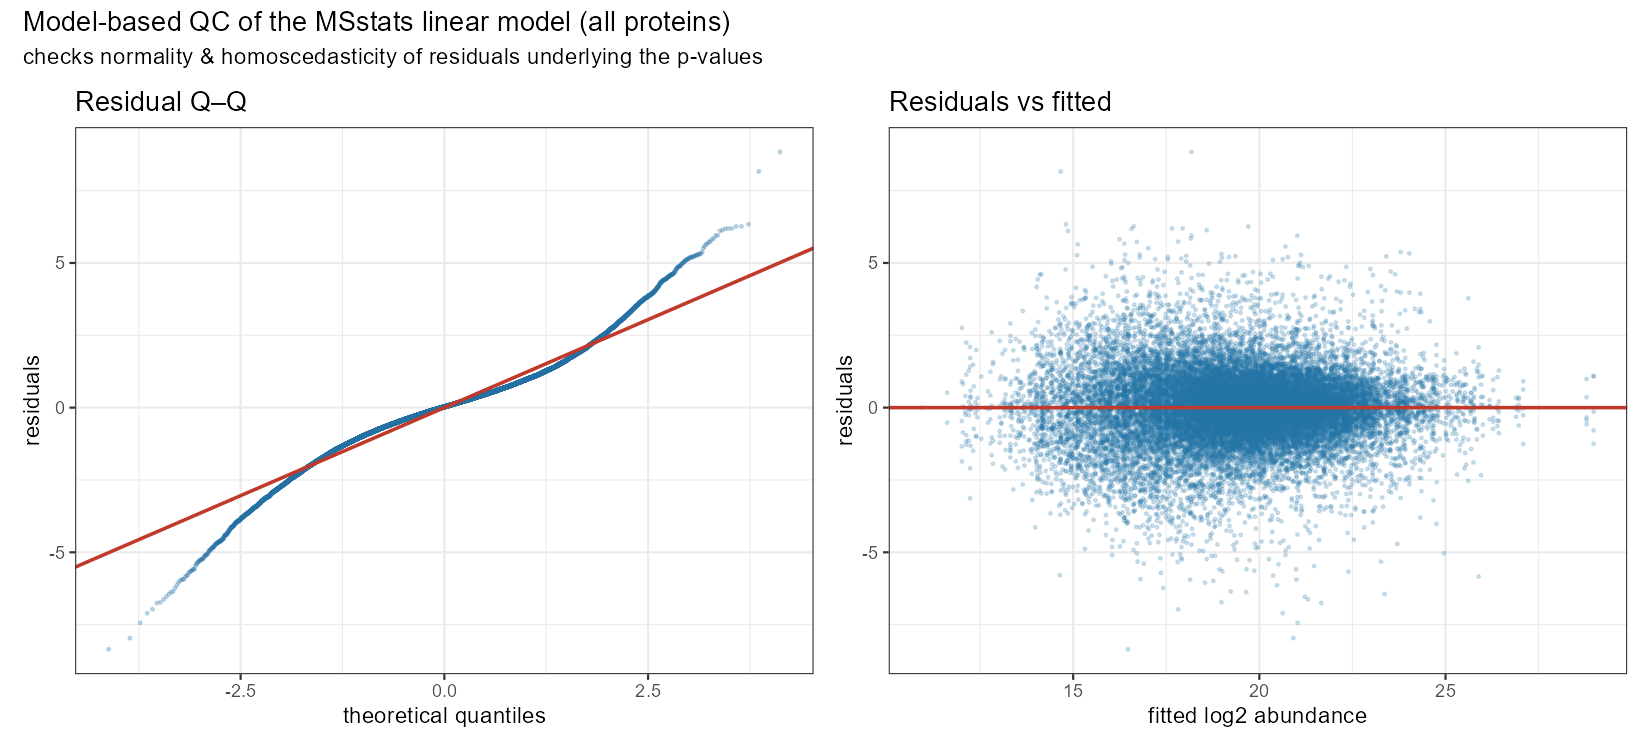
The final plot is a Model-based QC of the MSstats linear model. This figure checks two assumptions that underpin the p-values MSstats reports: that the model residuals are normally distributed and homoscedastic (constant variance). It pools the residuals from the per-protein linear models across the whole dataset. In the left panel is the Residual Q–Q plot that shows the ordered residuals (blue) against the quantiles you’d expect if they were perfectly normal (red diagonal). The middle section show that the bulk of residuals are well-behaved and approximately normal. However, the tails deviate which means there are more extreme residuals (large positive and negative) than a normal distribution predicts. This is common for proteomic data, and it means that extreme observations are not perfectly captured. The left hand panel shows the cloud centered on zero across the whole abundance range with no obvious curvature or trend, the model is not biased at any intensity level. The vertical spread is even, meaning MSstats log transform is working correctly. And the spread narrows at the low and high abundance ends due to spares data, rather than variance.
Overall better MSstats results would be obtained by analyzing the complete 40 sample dataset, and a higher number of samples per a group is also required for accurate fold change detection. As a proof of principle, we can see that MSstats has no issues using the file produced by the new Mascot Distiller report.
Keywords: AI, Mascot Distiller, reports, statistics