Top-3 Quantitation Summary in Mascot Daemon 3 using DDA-PASEF
Mascot Daemon includes a protein level quantitation summary report for both precursor based methods (LFQ, SILAC etc) and MS/MS quantitation (iTRAQ, TMT). The exported format is suitable for importing into statistic packages such as R or Perseus. In Mascot Daemon 3, we added an option to export protein intensity values calculated using the “Top-3″ method. Instead of using all matched peptides, only the intensity values from the three most intense matching peptides are used. Below is an example using a benchmark DDA-PASEF data set.
Example DDA-PASEF dataset
As an example of using the top-3 output from Mascot Daemon 3.0, we reprocessed one sample and three replicates from the timsTOF DDA files from PRIDE project PXD028735. The selected dataset is taken from a project where two hybrid proteome samples (A and B) comprising of known quantities of human, yeast and E.coli proteins were analysed in both DDA and DIA modes on a range of different instruments. This means we have known average take ratios for Sample A / Sample B for each of the proteomes:
| Species | Log2(Target Ratio) |
|---|---|
| H.sapiens | 0 |
| S.cerevisiae | 1 |
| E.coli | -2 |
Processing and searching the downloaded tdf raw files were automated using Mascot Daemon. The default timsTOF Mascot Distiller processing options were used. When processing timsTOF data, the precursor ion mobility can be used to filter the precursor signal during quantitation, improving accuracy and speeding the processing up as described in “Improving precursor quantitation results with ion mobility filtering.“
To enable this from Mascot Daemon, before starting the search task:
- Log into Windows as a user with Administrator privileges
- Type ‘cmd’ into the Windows search bar
- Right click over ‘Command Prompt’ and click ‘Run as Administrator’
- Navigate to the directory containing MascotDistiller.exe (by default this will be C:\Program Files\Matrix Science\Mascot Distiller)
- Run the following command:
MascotDistiller.exe -batch -daemonMGFIonMobilityParam 1
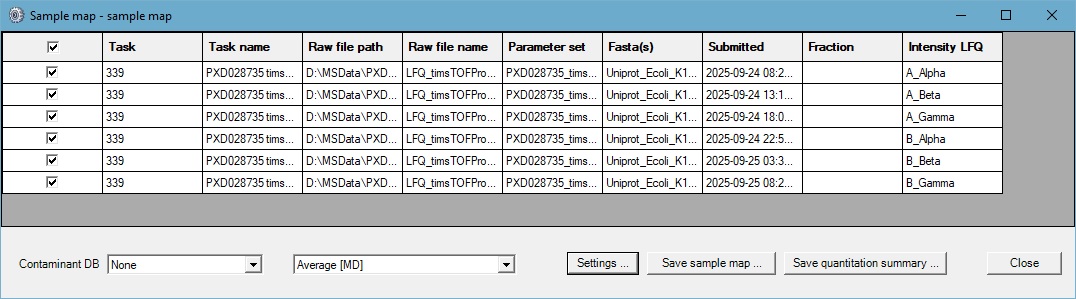
Peak-picking, searching and quantification using the “Average” label free quantitation method were automated using Mascot Daemon to process the tdf raw files for the Alpha, Beta and Gamma replicates of the first batch of Sample A and Sample B files from the PRIDE repository, comprising of 6 files in total.
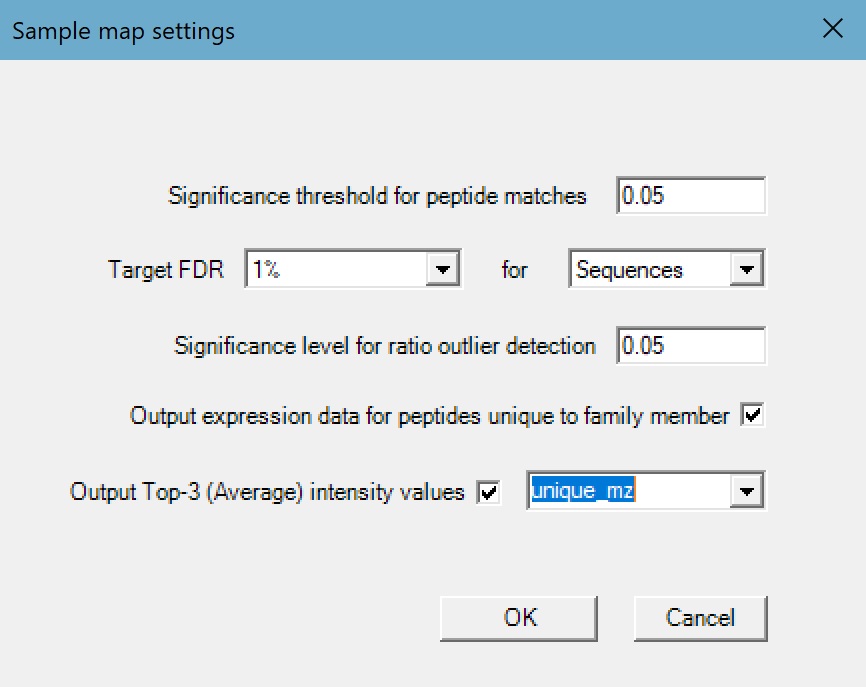
At a 1% peptide sequence FDR a total of 41068 peptide sequences from 372444 significant PSMs and a total of 8001 proteins (excluding same-set matches) were identified. The quantitation summary was setup as follows:
We then changed the settings so the generated report targeted a 1% sequence FDR in order to match the Mascot report, and to output the top-3 intensity value and expression data for peptides unique to a protein family member. With these settings enabled, the generated report contains the total and top-3 intensity values for each protein calculated using all assigned peptide matches, and again using only the peptides uniquely assigned to a protein. We can also choose between three options for the top-3 calculation:
- unique_sequence – the intensities for different charge and modification states for the same peptide will be summed together
- unique_mr – the intensities for different charge states of the same peptide and modification state will be summed together
- unique_mz – the intensities for different charge and modification states of the same peptide will not be summed together
Once the sample map and options are setup, click on the “Save quantitation summary …” button. The resulting file is a tab-separated values text file which can be imported into Excel. The table below shows the median log 2 ratios for Sample A / Sample B calculated from the protein total intensity and top-3 intensity using uniquely assigned peptides only:
| Species | Median Log2(Total Intensity A / Total Intensity B) | Median Absolute Deviation | N | Median Log2(Top 3 Intensity A / Top 3 Intensity B) | Median Absolute Deviation | N |
|---|---|---|---|---|---|---|
| H.sapiens | -0.167 | 0.291 | 4661 | -0.117 | 0.191 | 2688 |
| S.cerevisiae | 0.943 | 0.441 | 1561 | 0.725 | 0.238 | 606 |
| E.coli | -2.475 | 0.702 | 208 | -1.819 | 0.362 | 66 |
Top-3 intensity gives us median ratios closer to the target ratio for the Human and E.coli proteins, but it’s a little further away for the yeast proteins. Why the results from the yeast proteins aren’t performing as well as the other two species will be investigated further.
In all cases, however, the median average deviation is lower, so there is less spread in the calculated ratio values – in part because the values calculated by the top-3 method are less likely to be influenced by outlier peptide intensities as only the 3 most intense peptide sequence intensities are used in the calculation.
The main disadvantage of the approach is that you don’t get protein intensity values for proteins with fewer than 3 significant peptide sequence matches, so you don’t get so many protein intensities calculated for the proteins at the bottom of the report – this can clearly be seen in the lower number of proteins used to calculate the species median values in the table above.
Keywords: ddaPASEF, Mascot Daemon, Mascot Distiller, quantitation, quantitation summary, timsTOF