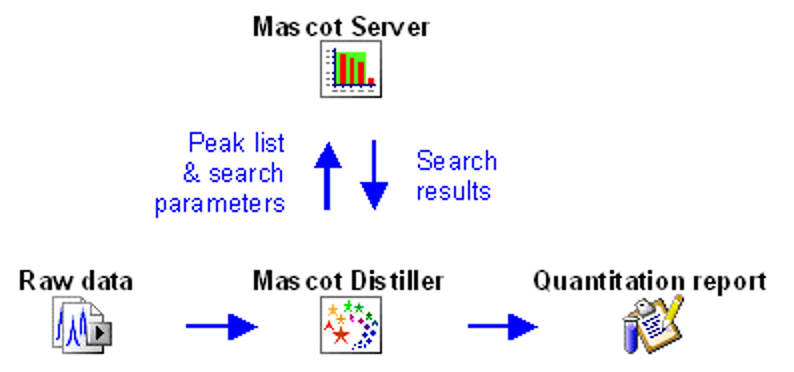
Mascot workflow for LC-MS/MS data
Data analysis in mass spectrometry proteomics is complex and, nowadays, almost entirely software driven. Processing a raw file, peptide identification by database searching, protein inference and protein quantitation all have many steps and built-in assumptions, not to mention a huge number of parameters. Software continues to evolve as does best practice. Whether you are new to mass spectrometry proteomics or a seasoned expert, it’s beneficial to periodically take a step back and study the basics.
Peak picking
The starting point of data analysis is a ‘raw’ file from a mass spectrometer, which contains survey (MS) scans followed by one or more MS/MS scans. In a bottom-up proteomics experiment, the goal is to identify all peptides present in the sample. This is almost always accomplished by searching the MS/MS spectra against a protein sequence database or spectral library.
Mascot Server does not read raw data, so the first step is to convert the raw file into peak lists, also called peak picking. This is an important step as it removes irrelevant noise, deisotopes and decharges peaks, reduces the file size and encodes important metadata of MS/MS spectra for downstream use. Your instrument data system may do peak picking for you, or you can use a third-party tool. We recommend Mascot Distiller, which has been designed to work with raw data from any instrument.
The tutorial How to configure Mascot Distiller peak picking covers all MS and MS/MS peak picking options. Mascot Distiller ships with default parameter sets for all vendors, and Peak picking Thermo .RAW data with Mascot Distiller examines the difference between two parameter sets for Thermo instruments. If you are new to Distiller, you are welcome to send us a typical raw file and ask us to return a suitable processing options file. Just email support@matrixscience.com for details.
If your sample is run in DDA mode (data-dependent acquisition), a small percentage of MS/MS spectra may include fragments from multiple peptides. If it’s run in DIA mode (data-independent acquisition), most of them will. Distiller supports chimeric DDA processing and has some support for narrow window DIA, where the isolation window is less than 8 m/z. In both cases, Distiller encodes precursor information in the peak lists in a format suitable for a Mascot search.
Database search
The tutorial Searching uninterpreted MS/MS data explains Mascot database search parameters and how to choose a sequence database. The best procedure is to run a standard sample, like a BSA digest, and use the results to set the optimal search parameters. Trying to set search parameters on an unknown is much more difficult but Mascot includes all the tools for doing so, as illustrated in Back to Basics: Optimize your search parameters.
The search engine gives each peptide match a score that reflects how well the database entry matches the observed MS/MS spectrum. Mascot calculates the probability that the match has occurred by chance, and the score is simply -10log10(p). Back to basics 5: Peptide-spectrum match statistics discusses the details and implications.
Probabilistic scoring is a necessary but not sufficient condition for high quality search results. You should always enable the Decoy checkbox in Mascot search parameters. When enabled, Mascot searches the peak lists against both the target database and a decoy database of reversed or randomised protein sequences. The count of decoy matches provides an excellent estimate of the number of false positives in the results from the target database, which is reported as the false discovery rate.
We also recommend rescoring the target-decoy results using Percolator, which is integrated with Mascot Server. Percolator uses semi-supervised machine learning to find optimal separation between target and decoy matches. If the decoy matches are a realistic model for false positive target matches, then the rescoring typically improves both the sensitivity (number of correct target matches flagged as statistically significant) and specificity (number of incorrect target matches flagged as non-significant). It is especially beneficial with ‘difficult’ data sets like endogenous peptides; see Identify more HLA peptides for an example.
Protein inference
The database search identifies peptides. All proteomics search engines must do an additional step to identify proteins, called protein inference. By default, Mascot only displays proteins that have at least one statistically significant peptide match that is unique to the protein hit (not shared with any other protein sequence). Proteins without unique peptide evidence – subset proteins – are hidden. Mascot does display sameset proteins, where two or more proteins share exactly the same peptide evidence. Because there is nothing in the mass spectra to differentiate between samesets, a ‘lead’ protein is selected and displayed by sorting protein accessions in alphanumeric order.
Mascot always shows a protein score for protein hits, but this is not a probabilistic score. Common myths about protein scores discusses a few misunderstandings that recur in the literature. When the sample is not too complex, Creating a list of confidently identified proteins is very easy using Mascot’s Report Builder. You should also check and at least record the value of the protein FDR, required by many journals.
The larger the database you are searching, the more likely it is to have sameset and subset proteins. If your sample is from a single species, the preferred taxonomy setting promotes proteins from the right species. With complex samples, additional context about the experiment is mandatory for deciding which sameset proteins are truly in the sample.
Quantitation
In most experiments, the goal is to not only identify proteins but also quantify the relative amounts across samples. The Mascot philosophy is identify first, then quantify. Once you have a list of peptide matches from the database search, peptides that meet the quality criteria are quantified. Then, proteins are quantified based on peptide quantitation.
The most popular protocols today are label-free quantitation (LFQ) and iTRAQ/TMT labelling. LFQ is based on extracted ion chromatograms (XICs) for precursors, whose source is the survey (MS) scans in the raw file. iTRAQ/TMT labelling produces reporter ions in the MS/MS spectrum, whose relative intensities are used as the peptide’s intensity in each sample. Regardless of the protocol, proteins are quantified based on peptide intensities or intensity ratios. Back to basics 3: Quantitation statistics discusses the good old statistical methods behind it.
Mascot Distiller supports other protocols too, and it’s a large topic. A good starting point is the Quantitation module in our free online training course, and please e-mail us if you have any questions about the best approach.
A table of raw numbers is hardly ever the finish line. Reporting quantitation datasets with Mascot Distiller 2.8 shows what you can do with the built-in reports. You can also export the data in CSV format for further processing in R or Perseus, or tabulate expression data from multiple analyses with Mascot Daemon. The Distiller project file (.rov) can also be imported in third-party tools like Scaffold.
Keywords: Mascot Distiller, peak picking, protein inference, quantitation, scoring, statistics, tutorial