Spectrum-centric searching of narrow window DIA data with Mascot Server
Data-independent acquisition (DIA) can be broadly separated into narrow window and wide window strategies depending on the size of the isolation window. There are also two data analysis strategies – peptide-centric and spectrum-centric. Wide window DIA typically requires a peptide-centric approach, but narrow window DIA data can be analysed either way. Mascot Server is spectrum-centric, and it’s possible to run a spectrum-centric search of narrow window DIA data using the chimeric search functionality.
Peptide-centric vs. spectrum-centric
The concept of peptide-centric searching was nicely described by Ting et al.[1]. In practice, a peptide-centric search starts with a library of experimental or predicted MS/MS spectra and compares these to the observed spectra, the aim being to find evidence for the expected precursors. A spectrum-centric search starts with a database of peptide sequences and compares their calculated fragment masses to the observed spectrum. The goal is to identify the precursor(s) in each spectrum.
Most current DIA software is peptide-centric. Although the approach has been a success, the disadvantage is that you always need a spectral library, even if it’s generated in silico (sometimes confusingly called “library free”). This puts a limit on the maximum number of protein sequences, variable modifications and missed cleavages – depending on the experimental library or machine learning model chosen. You also need to pay attention to the instrument the library is derived from – searching Orbitrap data against a timsTOF spectral library is unlikely to work well.
In contrast, a spectrum-centric search does not require spectral libraries, making it independent on the limits and assumptions associated with the libraries and machine learning models. A spectrum-centric match is easier to interpret and visualise as each identification has to stand on its own merits. Also, because the spectra are searched independently, the search scales easily across multiple processors.
Narrow window strategies (with an isolation window of generally no more than 8 m/z) will typically result in fewer peptides per MS/MS spectrum and therefore less convoluted data than wide window (isolation window > 8 m/z) approaches. As discussed in a previous blog article, narrow window DIA spectra are often of a similar complexity to chimeric data-dependent acquisition (DDA) datasets. This means it’s possible to apply traditional spectrum-centric analysis.
Example narrow window DIA dataset
As outlined on our help page about searching chimeric spectra, Mascot Distiller is currently able to process narrow window DIA data files generated by most Thermo instruments. To examine this, we’ve taken a publicly available narrow-window DIA dataset from the EBI PRIDE repository and reprocessed and searched using Mascot Distiller 2.8.5 and Mascot Server 2.8.3.
The selected dataset is from a prostate cancer study [2] which looked at various approaches for collecting and analysing proteomics data from matched groups of 20 prostate cancer and non-cancer patients, including narrow window DIA with an isolation window of 8 m/z. As with the wide-window DDA dataset processed in the earlier blog article, we re-processed the narrow-window DIA datafiles using Mascot Distiller, automating peak-picking and search submission with Mascot Daemon. The processing options used were the shipped prof_prof.ThermoXcalibur.opt settings with the follow changes:
- Allow up to 9 precursors per spectrum, in a range of +/- 4Da
- Uncentroiding the data at 400 points per Da
| No. of precursors masses | Count |
|---|---|
| 1 | 1293221 |
| 2 | 1150950 |
| 3 | 1978330 |
| 4 | 368796 |
| 5 | 182577 |
| 6 | 77935 |
| 7 | 28403 |
| 8 | 8928 |
| 9 | 3056 |
The generated peaklists were then searched using Mascot Server 2.8.3. Fragment ions were decharged to MH+ by Distiller prior to search submission. Search settings were taken from the paper. The entire process was automated using Mascot Daemon. Once completed, the Distiller project files created by Mascot Daemon were merged to generate a master project derived from all 40 raw data files. The merged results were adjusted for a 1% Peptide Spectrum Match False Discovery Rate and quantified using Mascot Distiller LFQ.
At the selected 1% PSM FDR the dataset has a total of approximately 1.6 million significant PSMs, covering 4296 protein hits and approximately 20.5 thousand peptide sequences, meaning roughy 32% of the spectra searched have one or more significant precursor matches. Results are summarised in table 2 below.
| Number of precursors | Significant precursor masses matched per sprectrum | Count |
|---|---|---|
| 1-9 | 1 | 1316967 |
| 2-9 | 2 | 150679 |
| 3-9 | 3 | 5832 |
| 4-9 | 4 | 73 |
| 5-9 | 5 | 1 |
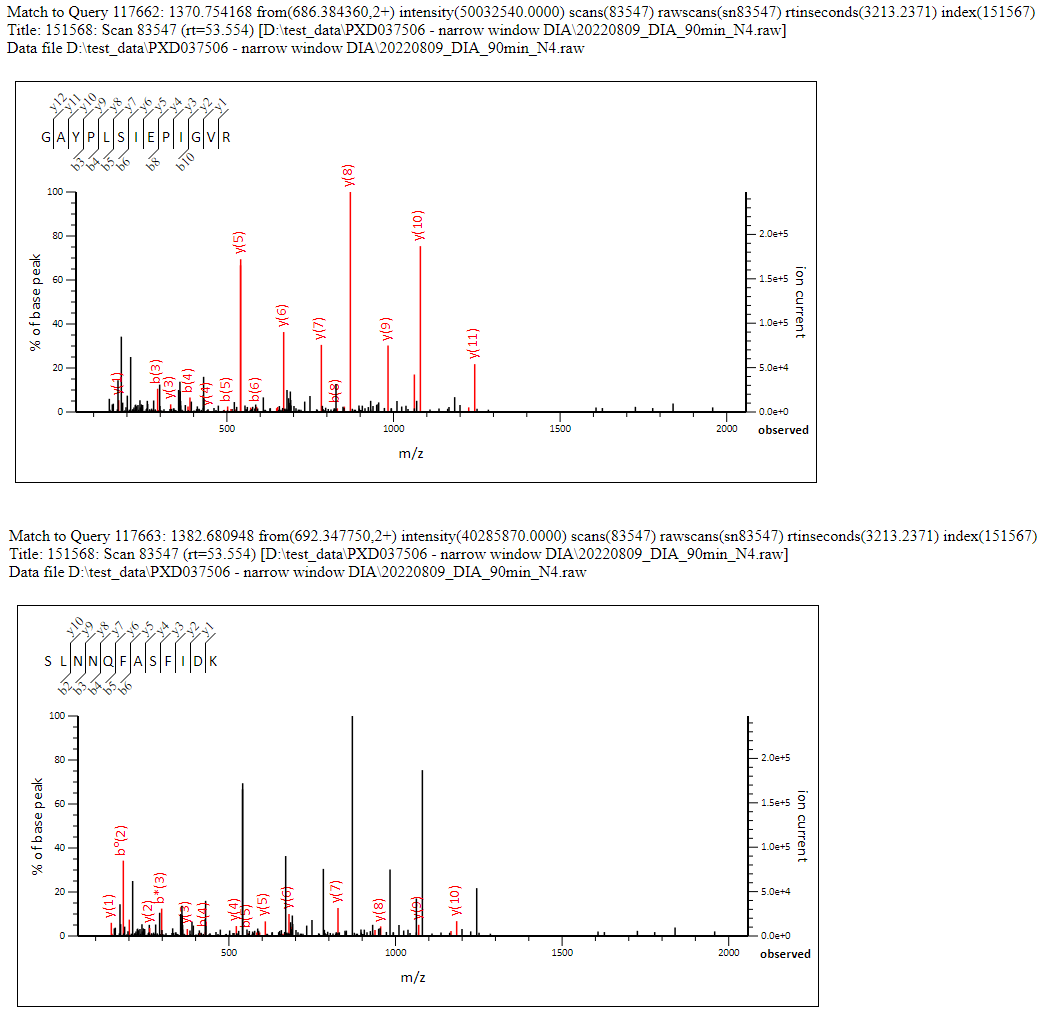
This works out at approximately 1.1 significant precursor masses matched per spectrum (ignoring the unmatched unassigned list). Clearly we’re getting most matches to the ‘dominant’ precursor, and a reasonable number of matches to the second most intense precursor as well, but beyond that the complexity of the spectra begin to have a strong negative effect on the scoring. Figure 1 below shows a nice example of a chimeric spectrum which had 2 precursor masses and two strong peptide matches which between them cover the majority of the most intense peaks in the spectrum.
Click to view full size image
Figure 1: Example chimeric match to a narrow window DIA MS/MS spectrum which had two precursors identified, each of which obtained a significant match in the Mascot database search. Between them, the two matches cover the majority of the most intense peaks in the spectrum.
Quantitation results
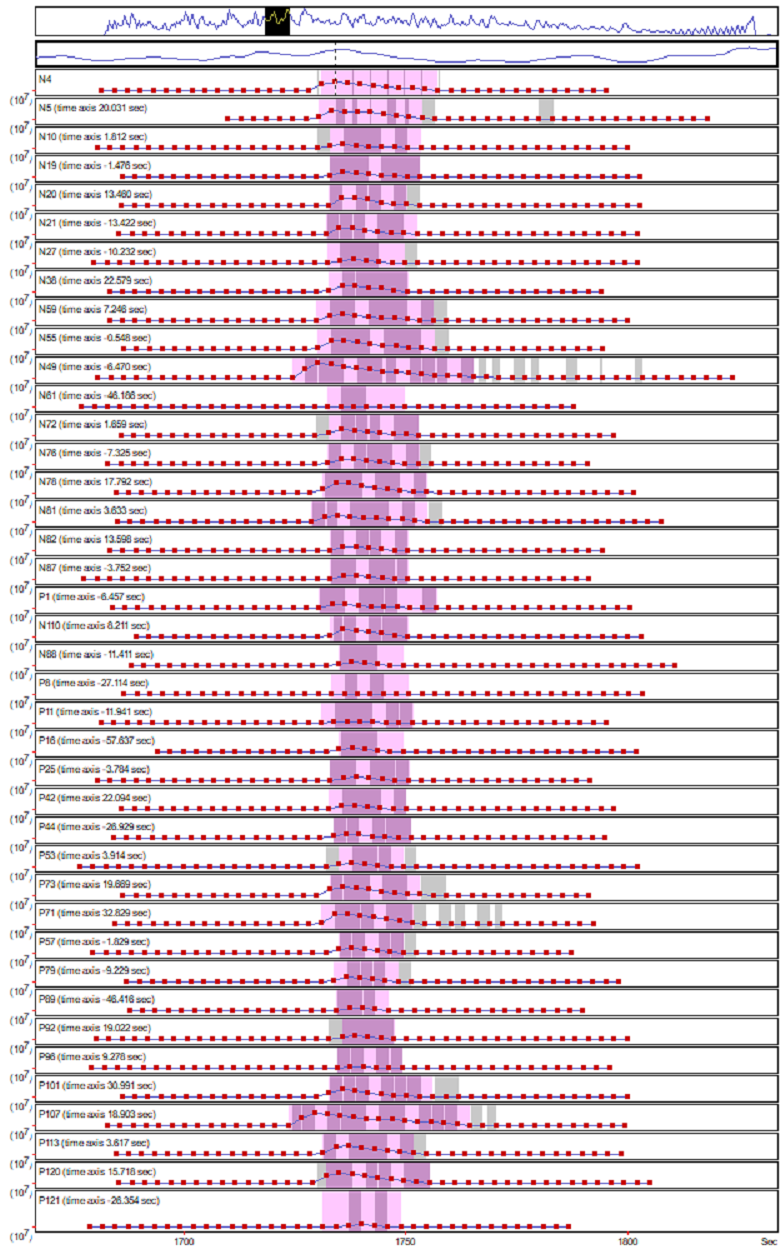
We used Mascot Distiller to run label-free quantitation on the entire dataset using time alignment and match between runs. Figure 2 below shows the XICs for a typical peptide match from the analysis. Because we’re taking a spectrum-centric approach we’re seeing peptide matches across the entire XIC region for most components, which gives us a high degree of confidence in the identifications.
Click to view full size image
Figure 2: Example XICs for a peptide match across the 40 samples included in the dataset. The grey bars on the graph show the regions where significant MS/MS matches to the peptide were identified.
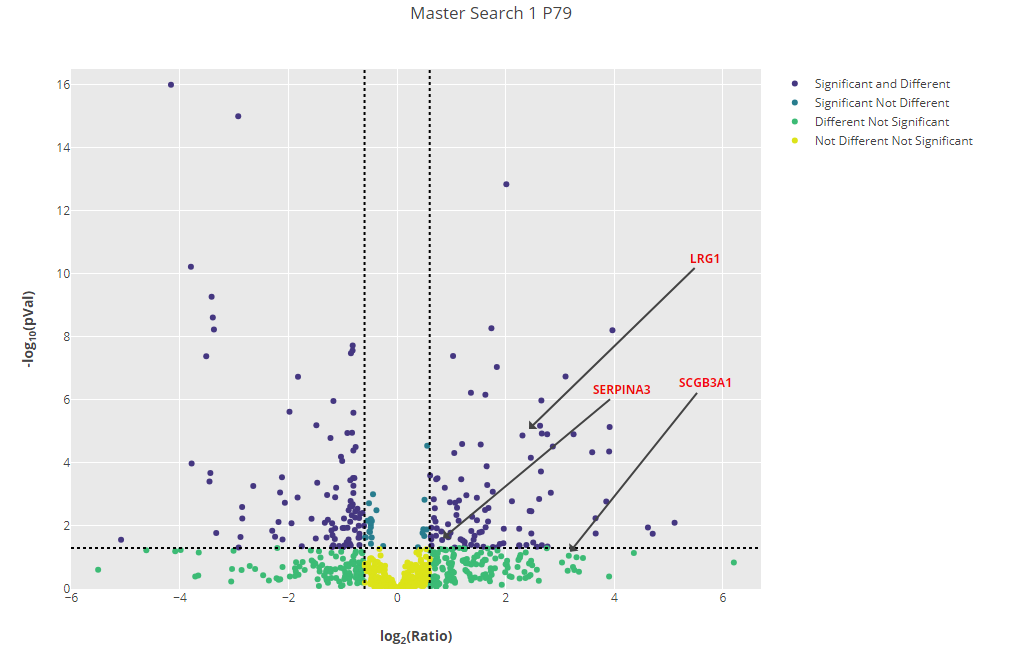
The authors of the original paper picked out 3 extracellular vesicle (EV) proteins which were consistently found to be upregulated in prostate cancer patient samples by all the experimental approaches taken, although figure 4 in the paper makes it clear that these were not found to be upregulated in all patient samples. The 3 EV proteins identified were:
- Alpha-1-antichymotrypsin (SERPINA3)
- Leucine-rich alpha-2-glycoprotein (LRG1)
- Secretoglobin family 3A member 1 (SCGB3A1)
Click to view full size image
Figure 3: Volcano plot for one of the samples (P79) with the three EV proteins identified by the original paper highlighted.
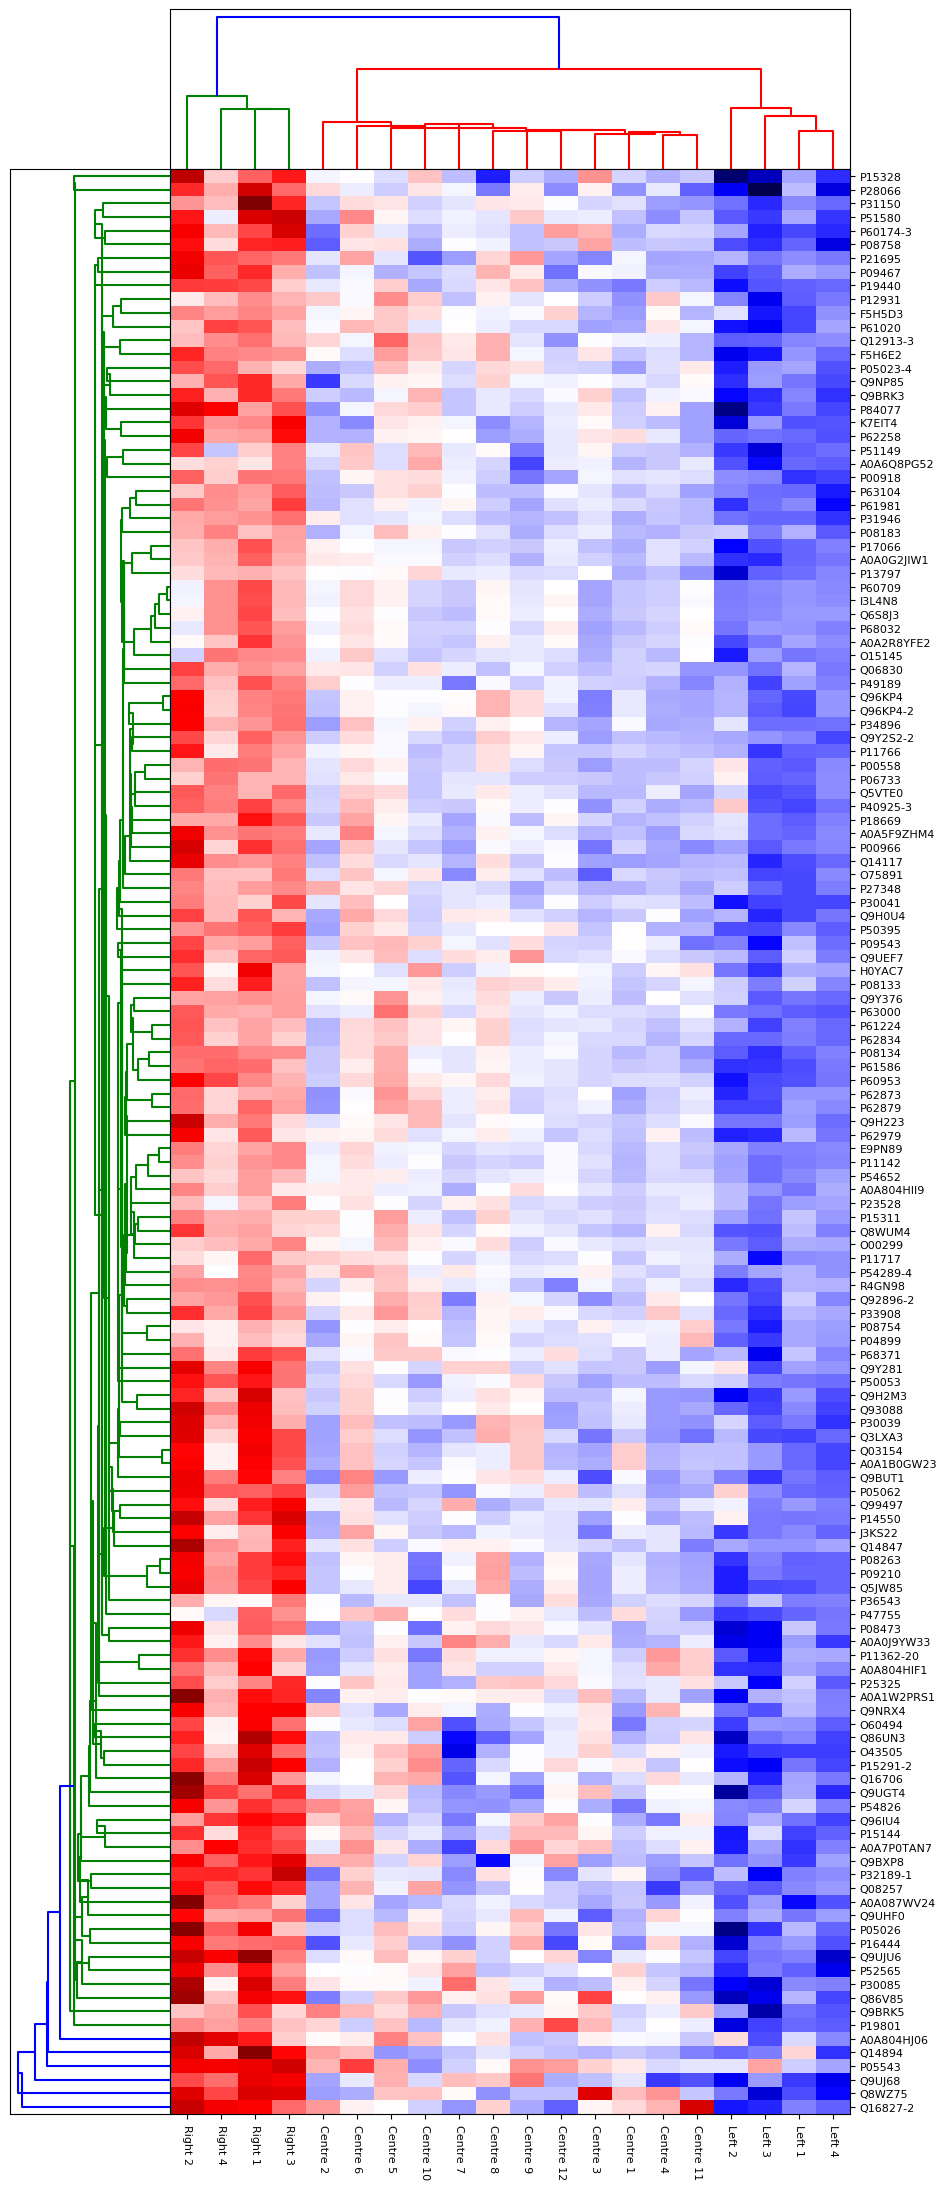
To explore the results a little more deeply, we ran the shipped Principal Component Analysis (PCA) report on the quantitation results. From the report we could broadly separate the 20 patients into 3 groups on the 1st component, which we called Left, Right and Centre. To examine which proteins were the cause of the differences, we took those groups and ran the “ANOVA plus Clustering” report in Distiller. This report runs an Analysis of Variance analysis, then takes the proteins which show significant differences between the groups and runs a hierarchical clustering analysis on those proteins. For the ANOVA analysis, we used a tight significance threshold of p < 0.001 with the Benjamini-Hochberg correction for multiple testing. Up to two missing ratio values per protein could be imputed using the K-Nearest Neighbours approach – if more ratio values were missing the protein was excluded from the analysis. The resulting hierarchical clustering report is shown in figure 4 below. As you can see, the three different groups separate very strongly on the proteins identified by the ANOVA. Many of these proteins are known to be associated with prostate or other cancers – for example ROBO4[3].
Click to view full size image
Figure 4: Hierarchical clustering of proteins identified as significantly different by ANOVA between three groups of patients identified by PCA.
Percolator
One way to increase sensitivity is to use Percolator. This uses additional features of the spectrum and peptide to rescore matches. In the current release of Mascot it is only possible to apply Percolator scoring to a single result file – you cannot generate a merged result and then apply percolator, which would be required by Distiller to run quantitation. This is a limitation that will be addressed in the next release of Mascot Server. In the meantime, to look at the potential improvement we took the results from the N4 sample from the project – which is the file which had the spectrum with 5 significant PSMs – and compared the unpercolated and percolated results. Results are summarised in table 3 below.
| No. matched precursors | N4 significant PSMs | Percolator | |
|---|---|---|---|
| 1 | 34436 | 47967 | |
| 2 | 3759 | 8917 | |
| 3 | 147 | 1089 | |
| 4 | 2 | 58 | |
| 5 | 1 | 2 | |
| No. peaklists with 1 or more significant precursor matches | 38345 | 47967 | |
| Total no. significant PSMs | 42408 | 59244 | |
| Mean no. sig. PSMs / matched spectrum | 1.11 | 1.24 |
As you can see, using percolator re-scoring is giving us a sizeable boost in the number of significant PSMs – we get an additional 16836 PSMs compared to the unpercolated results, an improvement of nearly 40%. In addition to that, we’re getting many more chimeric matches, so percolator re-scoring is improving the sensitivity of matching more complex spectra. We’d expect similar improvements if we could run percolator on the merged dataset.
Conclusions
The spectrum-centric analysis we’ve taken here has been broadly successful and we’re getting search and quantitation results which are in-line with those reported in the original paper. By taking a spectrum-centric approach, we’re able to carry out a standard database search of uninterpreted MS/MS data, avoiding the requirement for either experimental or predicted spectral library. This approach has clear benefits in handling unexpected modifications – with an experimental library the match needs to be present, and for a predicted library approach the modification of interest needs to have been included in the training data used for the model. Additionally, by using the precursor scans to identify and quantify the peptides, we’re making no assumptions regarding peptide retention time etc.
There are downsides to the approach of course. Mascot and Distiller are both designed principally for DDA workflows – it can therefore be tricky to process, pick out and report chimeric samples. You’ll need a very fast computer with plenty of memory in order to handle a dataset like this. There’s also a limit on the complexity of spectrum to which you will be able to get significant matches. Chimeric spectrum matching in Mascot will need additional improvements to work with more complex, wider window DIA data. Being able to apply Percolator rescoring to the merged dataset would clearly be beneficial for increasing the sensitivity of both matching and quantitation of results. Note, this limitation on Percolator rescoring does not apply if you merge the peaklists from all the samples and carry out a single search, but that is incompatible with the Mascot Distiller LFQ workflow.
We will, of course, be aiming to improve on many of the limitations in future releases of Mascot Server and Mascot Distiller, along with increased support for DIA data from additional instrument vendor raw file types and workflows.
References
- [1] Ting Y S et al. Molecular and Cellular Proteomics 2015, 14(9), 2301-2307. doi:10.1074/mcp.O114.047035
- [2] Zhang H et al. Molecules 2022, 27(23), 8155. doi:10.3390/molecules27238155
- [3] Pircher A et al. Int J Med Sci 2019, 16(1), 115-124. doi:10.7150/ijms.28735
Keywords: chimeric spectra, DIA, label-free, LFQ, Mascot Distiller, Thermo
Figure 3 has been updated after an error with normalisation was pointed out to us. The three proteins are still upregulated, but SCGB3A1 has fallen just below the significance threshold.