Mascot DIA workflow for LC-MS/MS
In a bottom-up proteomics experiment, the goal is to identify all peptides present in the sample. This is almost always accomplished by searching the MS/MS spectra against a protein sequence database or spectral library.
Identifying and quantifying proteins from LC-MS/MS runs in DIA mode has four steps:
- Mascot Distiller processes the raw data into peak lists
- Mascot Server identifies peptides
- Mascot Server infers proteins from the peptide matches
- Mascot Distiller provides protein quantitation and produces a report
All steps can be automated using the Mascot Daemon client shipped with Mascot Server.
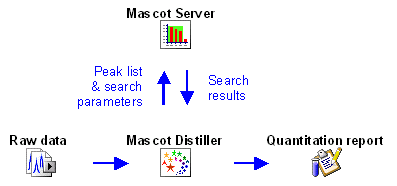
The workflow is exactly the same for Mascot DDA and Mascot DIA, but peak picking and scoring differ.
1. Peak picking
The starting point of data analysis is a ‘raw’ file from a mass spectrometer, which contains survey (MS) scans followed by one or more MS/MS scans. In DIA mode, each MS/MS scan is assumed to contain fragments from multiple precursor with similar precursor m/z and retention time.
Mascot Server does not read raw data, so the first step is to convert the raw file into peak lists, also called peak picking or peak detection. This is an important step as it removes irrelevant noise, deisotopes and decharges peaks, reduces the file size and encodes important metadata for downstream use.
The peak list for each MS/MS scan must specify the masses of precursors whose fragments are likely to be present in the scan, as the Mascot database search requires precursor masses to be known. Mascot Distiller detects precursors from MS1 and MS2 scans using a novel precursor detection algorithm.
2. Database search
The protein database search finds the ‘best’ candidate peptides for each MS/MS spectrum based on the precursor masses and the MS/MS fragment peaks.
In DIA mode, Mascot matches precursors independently to the observed spectrum. Fragments are allowed to overlap between precursors, and Mascot does not make guesses about the relative intensities of fragment peaks. Instead, the algorithm tries to maximise the number of peaks explained by each candidate peptide, including any neutral loss peaks.
The score of a peptide match reflects how well the database entry matches the observed MS/MS spectrum. Mascot calculates the probability that the match has occurred by chance, and the score is simply -10log10(p).
Probabilistic scoring is a necessary but not sufficient condition for high quality search results. Mascot Server automatically searches the peak lists against a decoy database of reversed or randomised protein sequences. The count of decoy matches provides an excellent estimate of the number of false positives in the results from the target database, which is reported as the false discovery rate.
We also recommend rescoring the results using machine learning. It is especially beneficial with ‘difficult’ data sets like endogenous peptides, proteogenomics and metaproteomics. Mascot Server includes Percolator and MS2Rescore.
The tutorial Searching uninterpreted MS/MS data explains Mascot database search parameters and how to choose a sequence database.
3. Protein inference
The database search identifies peptides. All proteomics workflows must do an additional step to identify proteins, called protein inference.
By default, Mascot only displays proteins that have at least one statistically significant peptide match that is unique to the protein hit (not shared with any other protein sequence). Proteins without unique peptide evidence – subset proteins – are hidden. Mascot does display sameset proteins, where two or more proteins share exactly the same peptide evidence. Because there is nothing in the mass spectra to differentiate between samesets, a ‘lead’ protein is selected and displayed by sorting protein accessions in alphanumeric order.
Mascot always shows a protein score for protein hits, but this is not a probabilistic score. Common myths about protein scores discusses a few misunderstandings that recur in the literature. Creating a list of confidently identified proteins is very easy using Mascot’s Report Builder.
4. Quantitation
In most experiments, the goal is to not only identify proteins but also quantify the relative amounts across samples. The Mascot approach is identify first, then quantify. Once you have a list of peptide matches from the database search, peptides that meet the quality criteria are quantified. Then, proteins are quantified based on peptide quantitation.
The most popular protocol for DIA is label-free quantitation (LFQ), which is based on extracted ion chromatograms (XICs) for precursors. Mascot Distiller implements MS1 quantitation, meaning the signal is extracted from survey (MS) scans in the raw file. Proteins are quantified based on peptide intensities or intensity ratios.
Mascot Distiller supports other MS1 protocols too. Any chemistry that creates a precursor mass shift can be used, e.g. 18O, metabolic and SILAC.
A table of raw numbers is hardly ever the finish line. Reporting quantitation datasets with Mascot Distiller shows what you can do with the built-in reports and how to write custom reports. You can also export the data in CSV format for further processing in R or Perseus, or tabulate expression data from multiple analyses with Mascot Daemon. The Distiller project file (.rov) can also be imported in third-party tools like Scaffold by Proteome Software.
Third-party software for peak picking and quantitation
Mascot Distiller is currently the only software that produces suitable peak lists for spectrum-centric DIA searching. We are working with Thermo to include Mascot DIA support in Proteome Discoverer™.
If you are new to Distiller, you are welcome to send us a typical raw file and ask us to return a suitable processing options file. Just email support@matrixscience.com for details.